


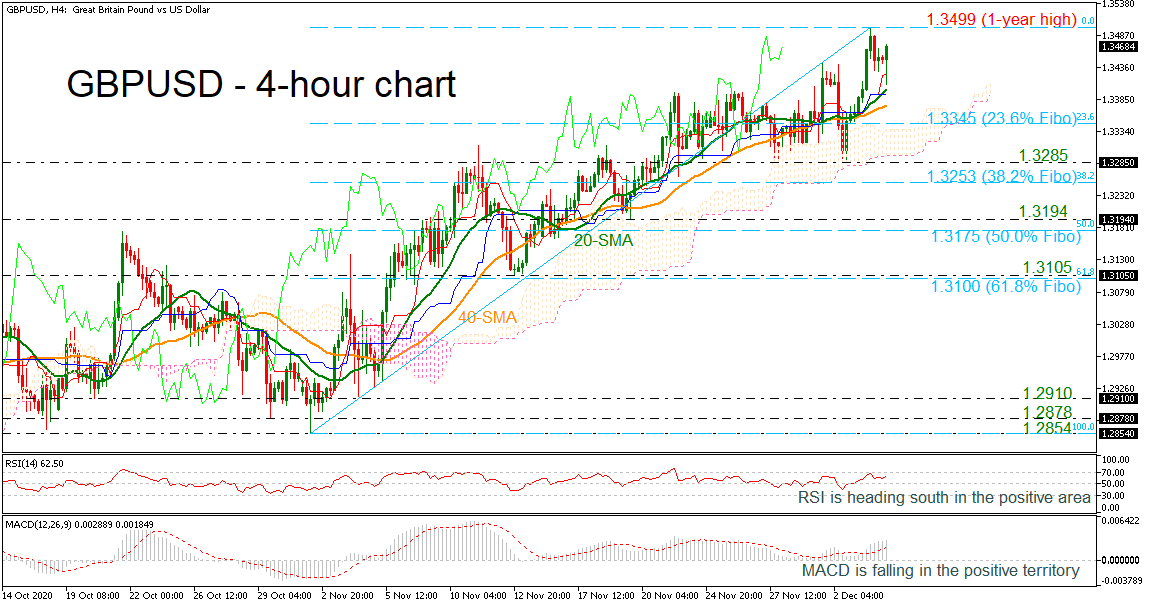
 GBPUSD is losing ground after it reached a fresh one-year high marginally below 1.3500 on Thursday. The momentum indicators suggest there is still some downside move before the pair advances again. The RSI is heading south in the positive area, while the MACD is losing momentum in the bullish territory.
Should the price make another run higher, it’s likely to meet resistance at 1.3499. A successful break above this key resistance could open the way for the May 2018 high at 1.3600 before challenging the 1.3710 resistance, taken from the inside swing low on February 2018.
If the positive momentum fails to hold and prices turn lower, the 20-period simple moving average (SMA) at 1.3397 and the 40-period SMA at 1.3372 are the nearest supports that could halt steeper declines. A potentially more important support, though, is the 23.6% Fibonacci retracement level of the up leg from 1.2854 to 1.3499 at 1.3345. If breached, it could shift the focus to the downside and prices could slip inside the Ichimoku cloud around the 1.3285 barrier.
In the bigger picture, GBPUSD would need to make a sustained climb above 1.3500 in order for the outlook to become convincingly bullish.
Origin: XM


