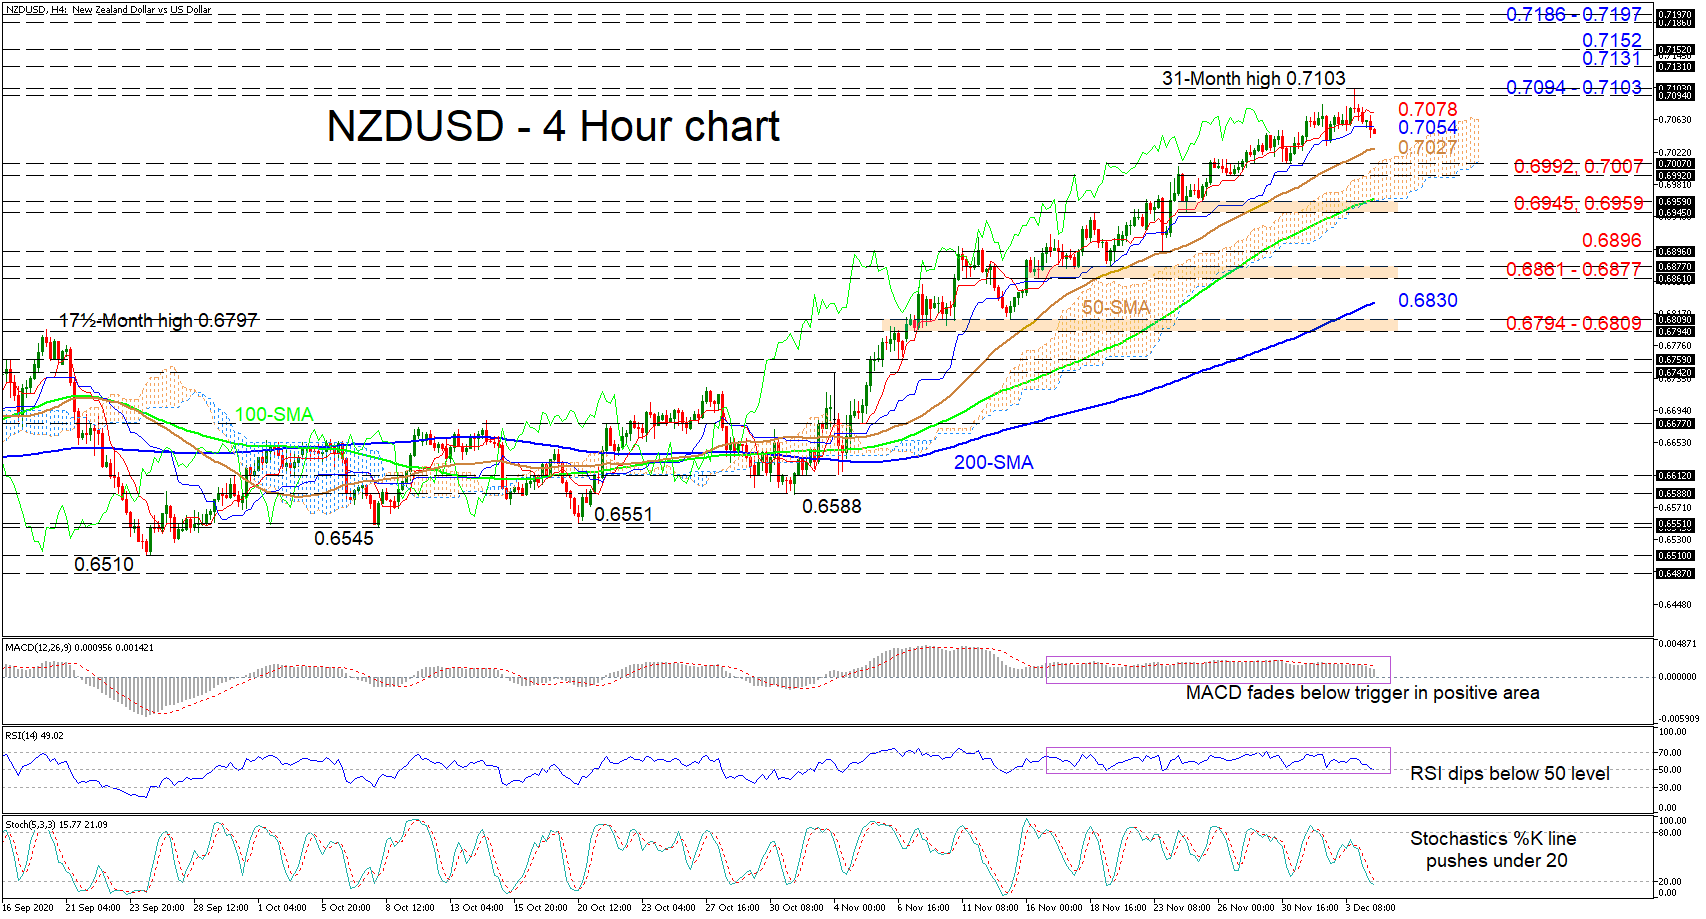
 NZDUSD is receding below the flattening blue Kijun-sen line around 0.7054 in the four-hour chart, after a bullish trend off 0.6612 thrusted the pair up towards a 31-month high of 0.7103. The Ichimoku lines are indicating some stalling in positive price action, while the soaring simple moving averages (SMAs) are safeguarding the positive structure.
Nevertheless, the short-term oscillators are echoing clues that a deeper negative retracement could unfold before the climb resumes. The MACD, after hovering for some time beneath its red trigger line, is fading in the positive region, while the RSI, which has for a while zig zagged between the 50 and 70 levels, is dipping below its neutral threshold. Further backing this view is the stochastic oscillator, with falling %K and %D lines promoting a more potent pullback.
To the downside, initial support may develop from the 50-period SMA at 0.7027 and around the cloud’s upper band, in addition to the nearby lows of 0.7007 and 0.6992. Retreating into the cloud, sellers may face the 100-period SMA and cloud’s floor, reinforcing a key support zone produced between the 0.6959 and the 0.6945 troughs. Steeper declines from here may then hit the 0.6896 barrier ahead of the region of lows between 0.6861 and 0.6877.
However, if buyers re-emerge, upside pressures may develop until the resistance band of 0.7094-0.7103. Resuming the ascent, the bulls may meet the 0.7131 high from April 2018 ahead of the 0.7152 barrier. Steering further northwards, the pair may then encounter the limiting section of 0.7186-0.7197.
Summarizing, NZDUSD maintains its short-term bullish bearing above the 0.6794-0.6809 buffer zone, the cloud, and the 0.7007 mark. A shift below the area 0.6945-0.6959 (including the 100-period SMA), could trigger a bigger bearish correction.
Origin: XM