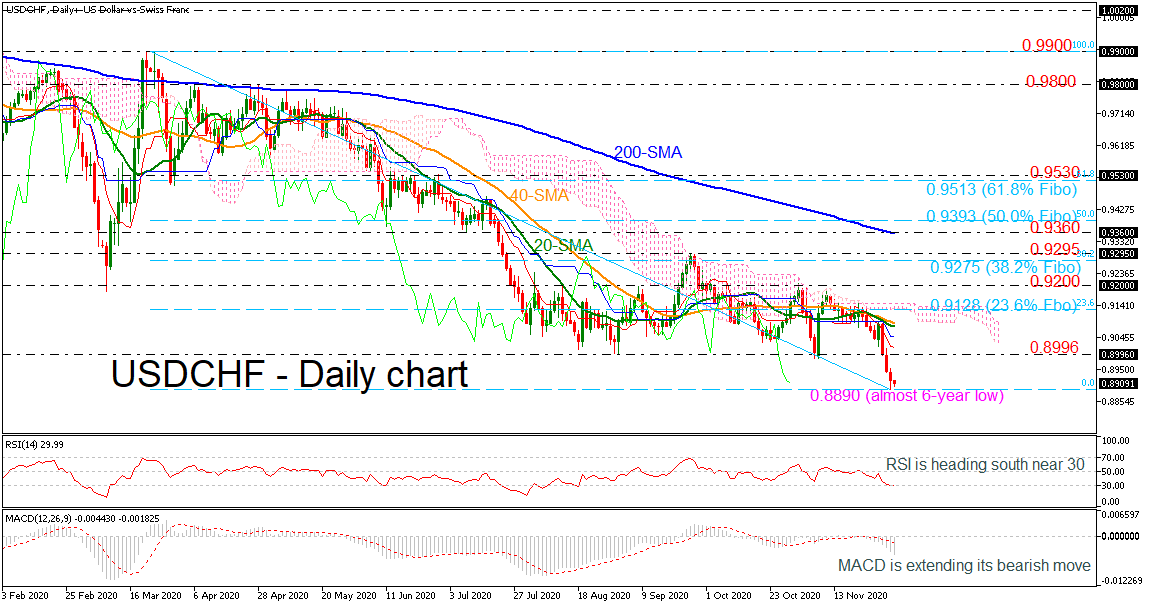
 USDCHF plummeted to an almost six-year low on Thursday, hitting the 0.8890 mark. The pair has been in a strong descending movement since March 20, with no clear upside retracement in the daily timeframe.
The RSI is approaching the oversold territory, strengthening its bearish momentum, while the MACD is extending its negative structure beneath its trigger and zero lines. However, the Ichimoku lines and the 20- and 40-day simple moving averages (SMAs) seem to be somewhat flat despite the selling interest over the last three straight days.
In the negative scenario, a sell-off beneath the six-year low could open the way for the 0.8670 support, taken from the inside swing low on March 2014. If the bears drive the market even lower, the next target could come from the 0.8210 obstacle, registered in January 2015.
However, should the price close comfortably above the 0.8996 resistance, traders could add more value to the pair, pushing the market up to the 20- and 40-day SMAs currently at 0.9080. The 23.6% Fibonacci retracement level of the down leg from 0.9900 to 0.8910 at 0.9128 has been a significant resistance ahead of the 0.9200 psychological level. Above that, the 38.2% Fibonacci of 0.9275 and the 0.9275 could attract traders’ attention.
In brief, USDCHF is in a bearish mode in the short- and long-term timeframes, and any increases above the 200-day SMA, which overlaps with the 0.9360 resistance, may change this outlook to neutral.
Origin: XM