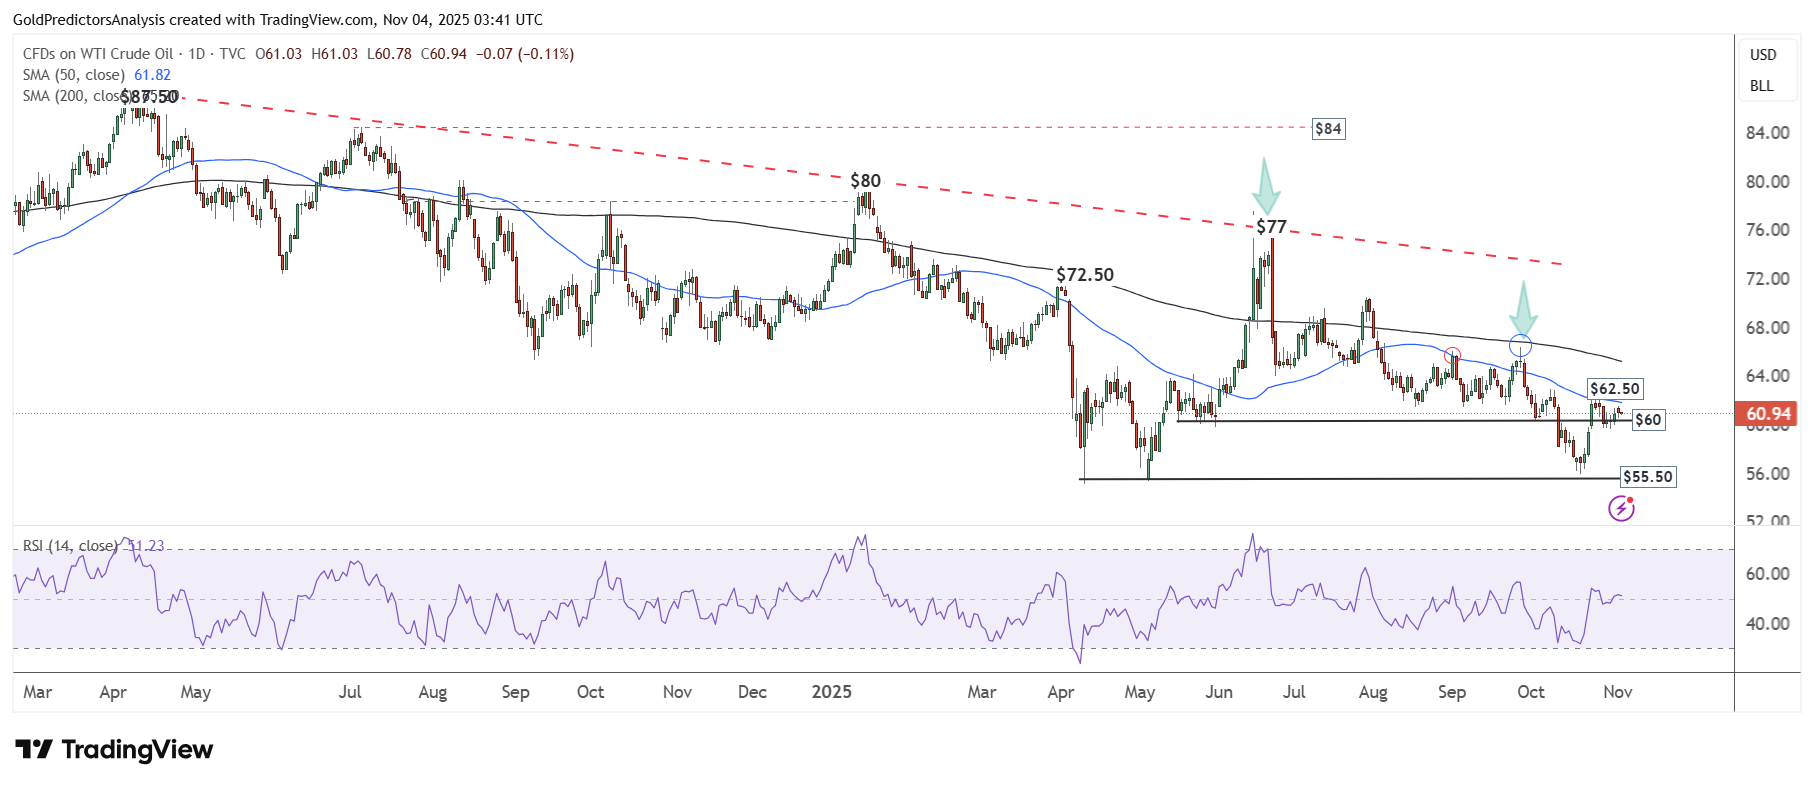
 The daily chart for WTI crude oil shows that prices continue to consolidate below the 50-day SMA. The price is hovering around the $60 to $62 area after rebounding from the $55 support. This consolidation reflects market uncertainty, with prices searching for direction.
However, the RSI remains above the mid-level, suggesting that a new move is developing. A break back above the 50-day SMA near $62 would signal further upside toward the 200-day SMA around $65. As long as prices stay below the $65 region, the outlook for oil remains bearish.
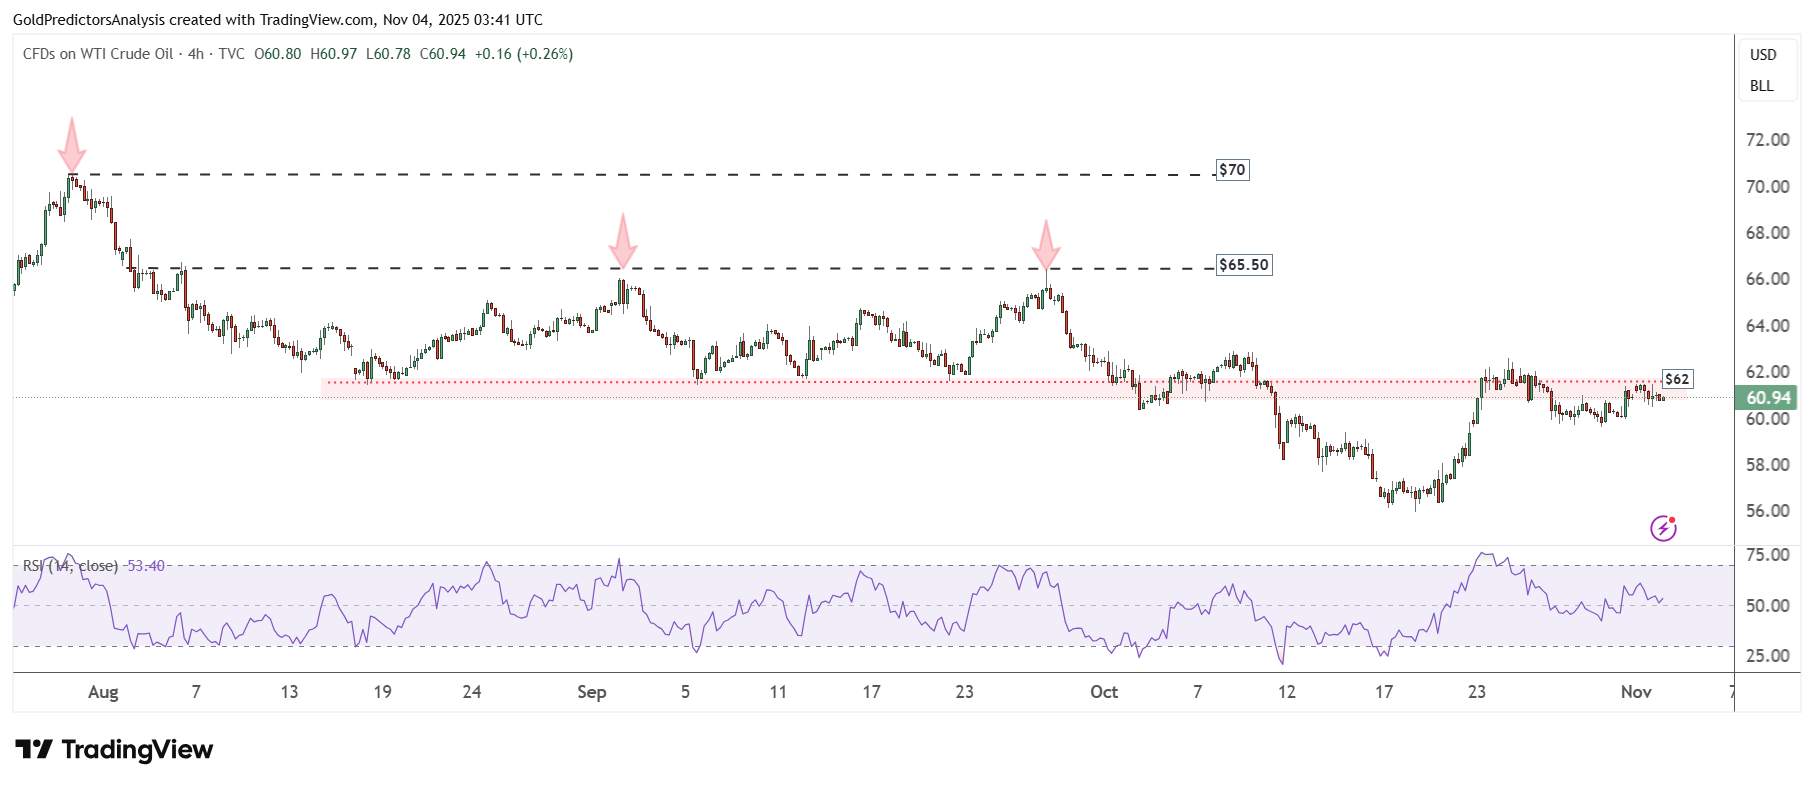
WTI Oil 4-Hour Chart – Negative Price Action
The 4-hour chart for WTI crude shows that the price is consolidating below the resistance near the $62 region. This consolidation reflects market uncertainty and a lack of clear direction.
However, the RSI remains well above the mid-level, confirming that prices are in a neutral zone. The indicator suggests that the market is waiting for a breakout to determine the next move.