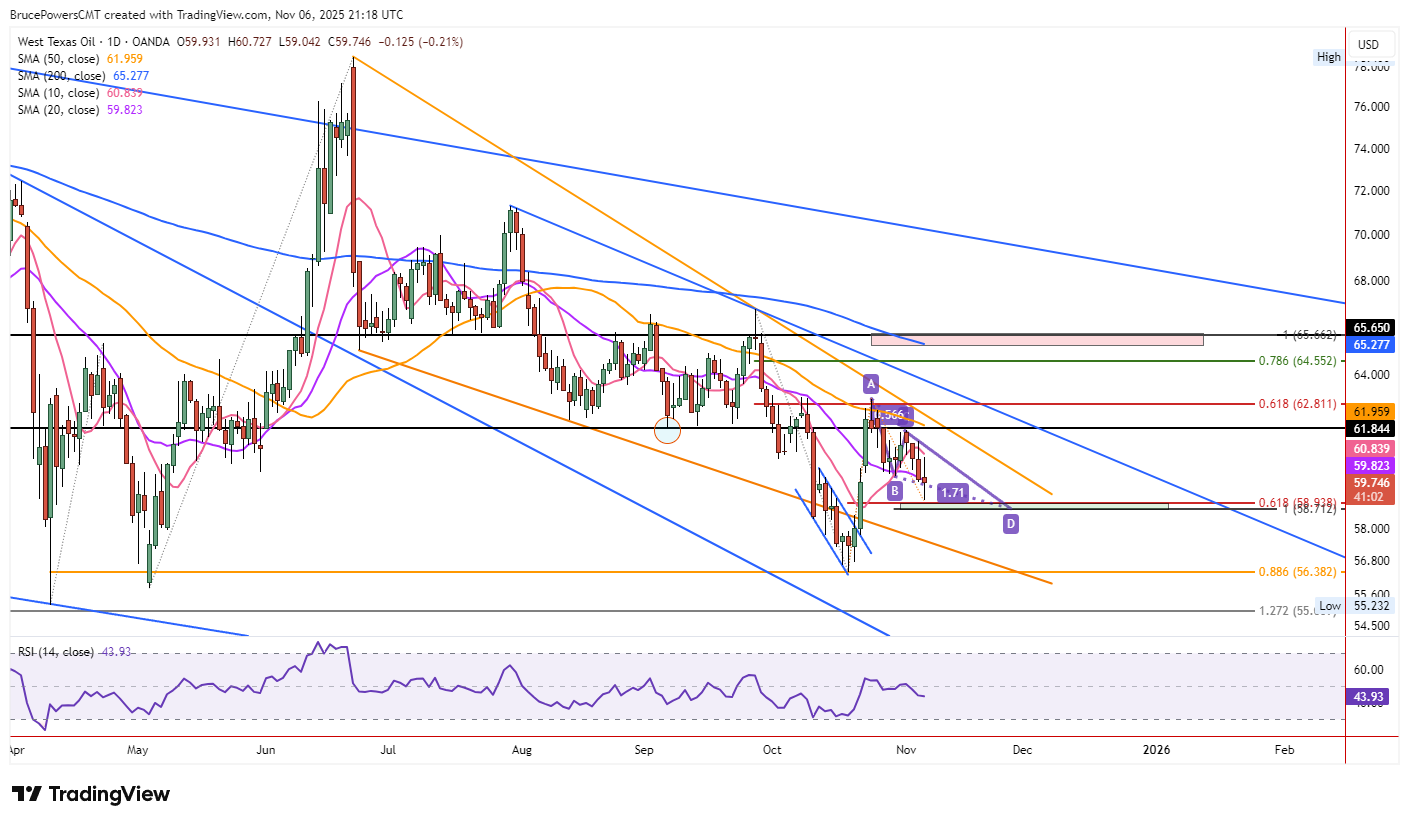
 Crude oil extended its losses on Thursday, printing a fresh pullback low of $59.04. The 20-day moving average at $59.82 was decisively violated after yesterday’s test, with price now trading in the lower half of the daily range and poised to close below that key benchmark for the first time since the October breakout.
Support Cluster
A critical support zone sits immediately below current levels, defined by the 61.8% Fibonacci retracement at $58.94 and the completion of a falling ABCD pattern at $58.71. At point D, the two minor declining legs from the recent swing high (A) match exactly in price change, satisfying pattern symmetry. While a bearish continuation below this zone remains possible, odds favor an eventual bullish reversal here given the prior sharp advance and single-leg structure off the October low.
Initial Rally Context
The rally began with a dramatic bullish reversal on October 22 from a small declining channel. Follow-through was impressive: price exploded higher and confirmed strength via clean breaks above both the 10-day and 20-day moving averages. Resistance materialized near the declining 50-day average, marking the first meaningful pullback since the advance began—classic behavior after a single impulsive leg.