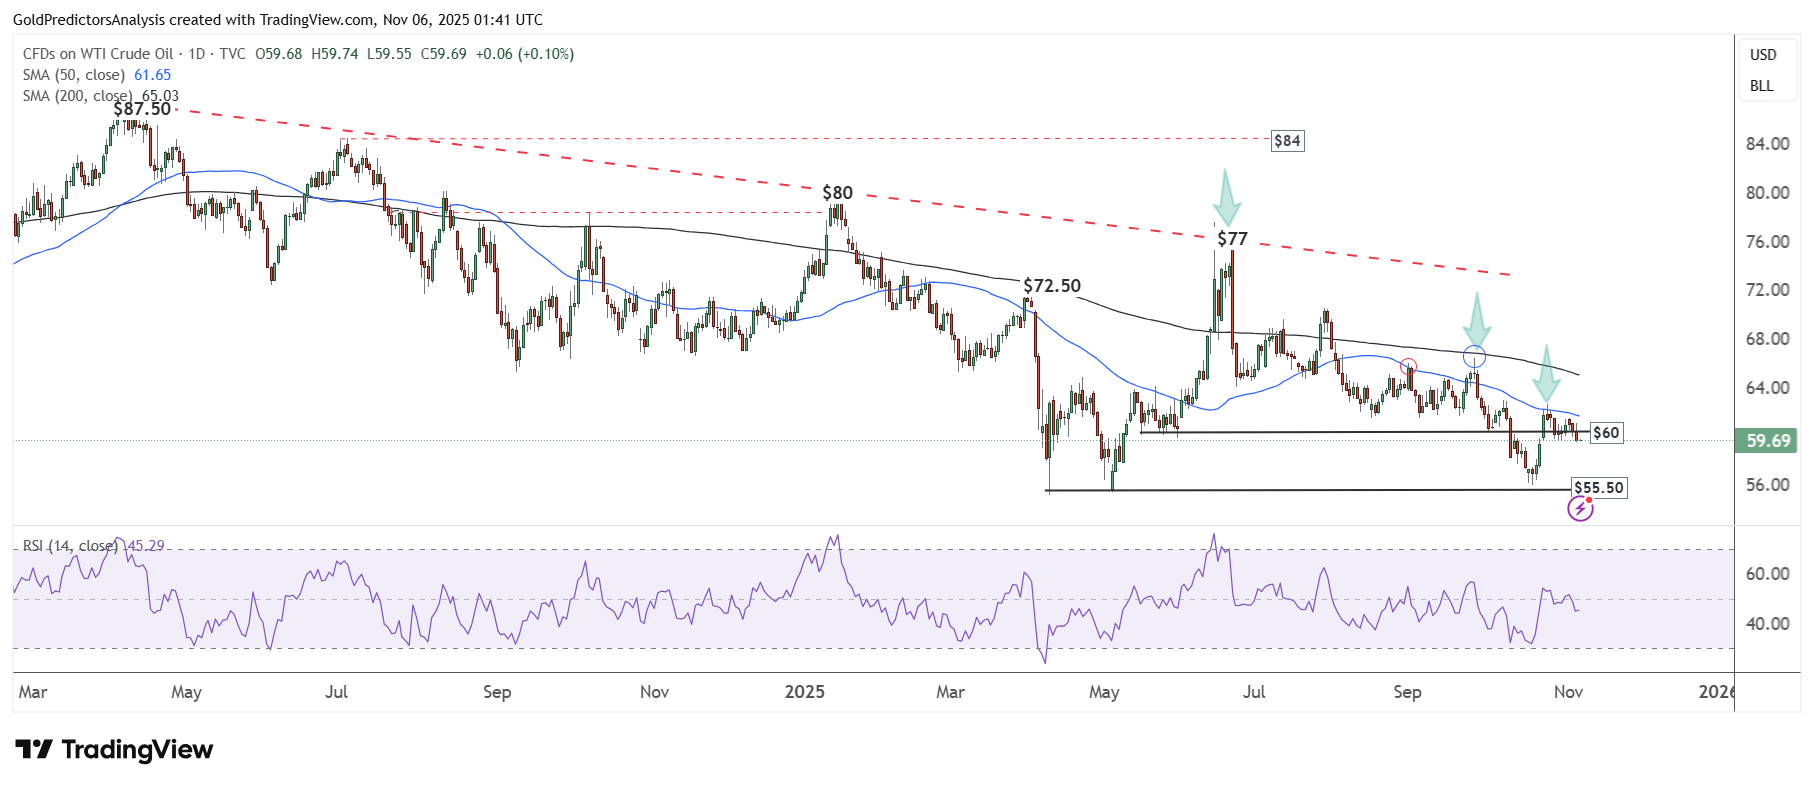
 The daily chart for WTI crude oil shows that the price remains under pressure. It failed to break above the 50-day SMA and continues to move lower.
A daily close below the $60 level indicates that the price is likely to fall further toward the $55 area. Moreover, the RSI remains below the midline, signalling additional downside potential in the short term.
WTI Oil 4-Hour Chart – Negative Price Action
The 4-hour chart for WTI crude oil shows that the price has continued to decline after consolidating below the $62 level. The RSI is also holding below the midline, indicating further downside in the short term. As long as WTI remains below the $63 level, the next move in oil prices is likely to be lower.