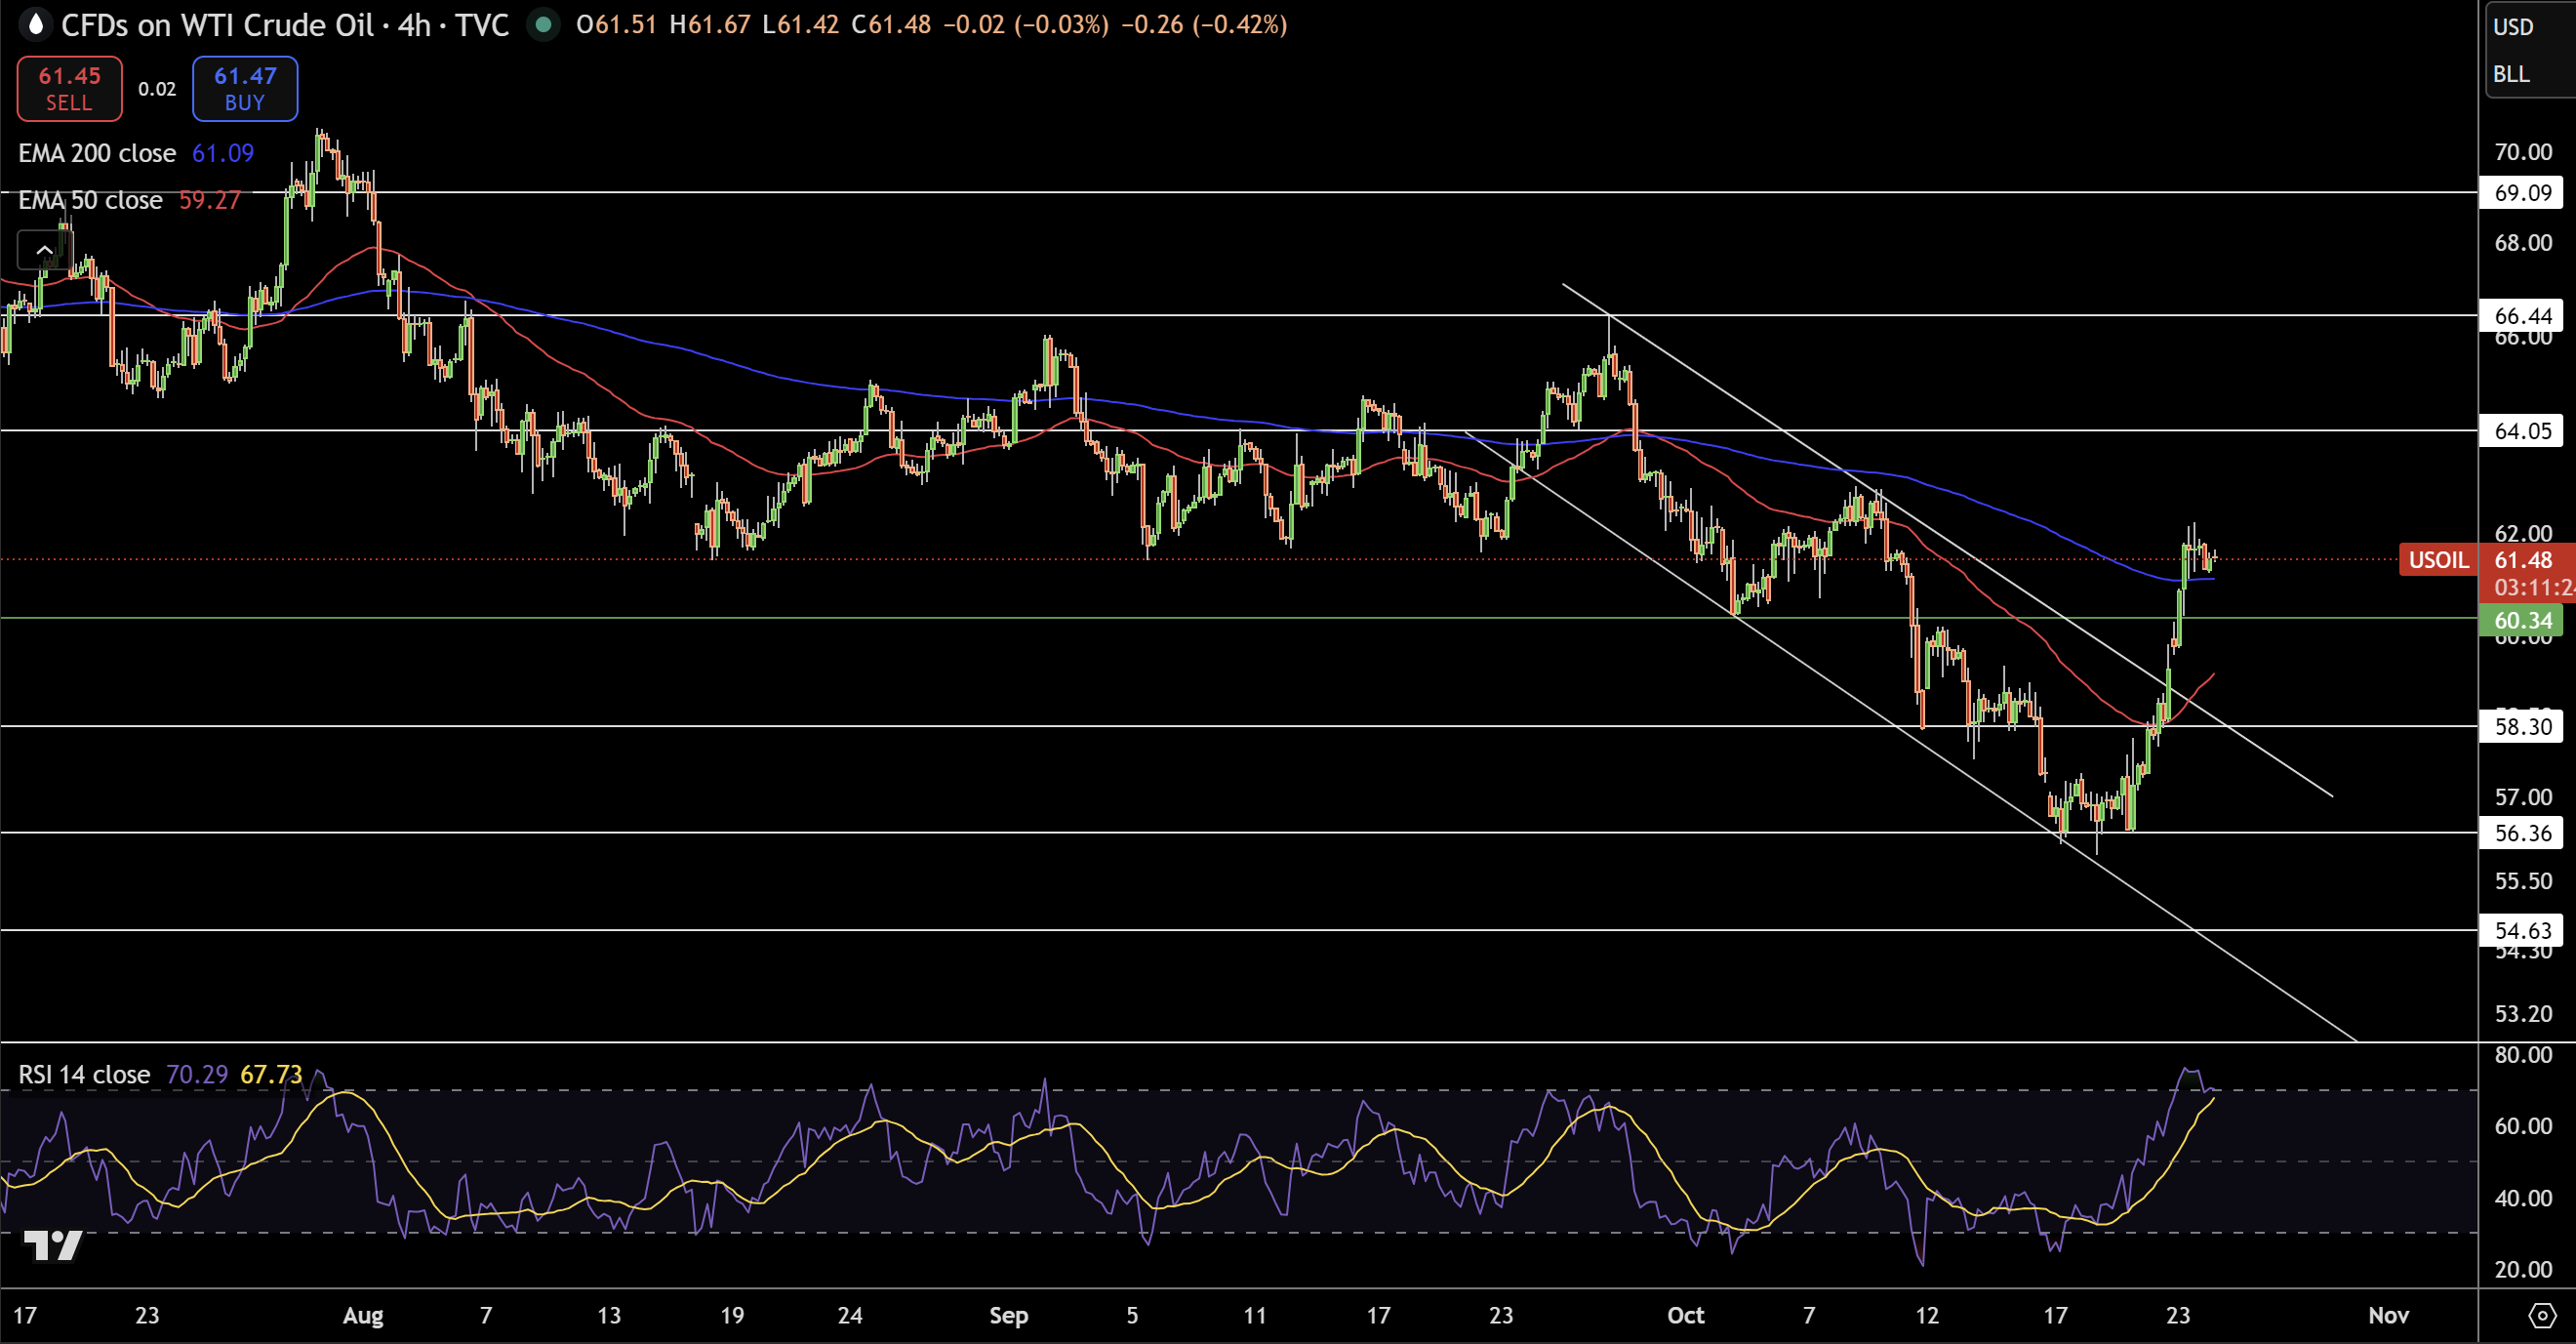
 WTI crude oil is trading around $61.48, stabilizing after a strong rebound from the $56.30 level. The price has moved above the descending channel and is now testing resistance at the 200-day EMA ($61.09). The 50-EMA ($59.27) is trending upward, showing improving short-term momentum.
However, the RSI near 70 suggests buying pressure may be cooling, hinting at possible consolidation. A sustained move above $61.60 could open the path toward $64.00, while failure to hold above $60.30 might lead to a pullback toward $58.30.
Overall, WTI remains in recovery mode but traders are watching for confirmation above key resistance before expecting further upside.
Brent Oil Price Forecast
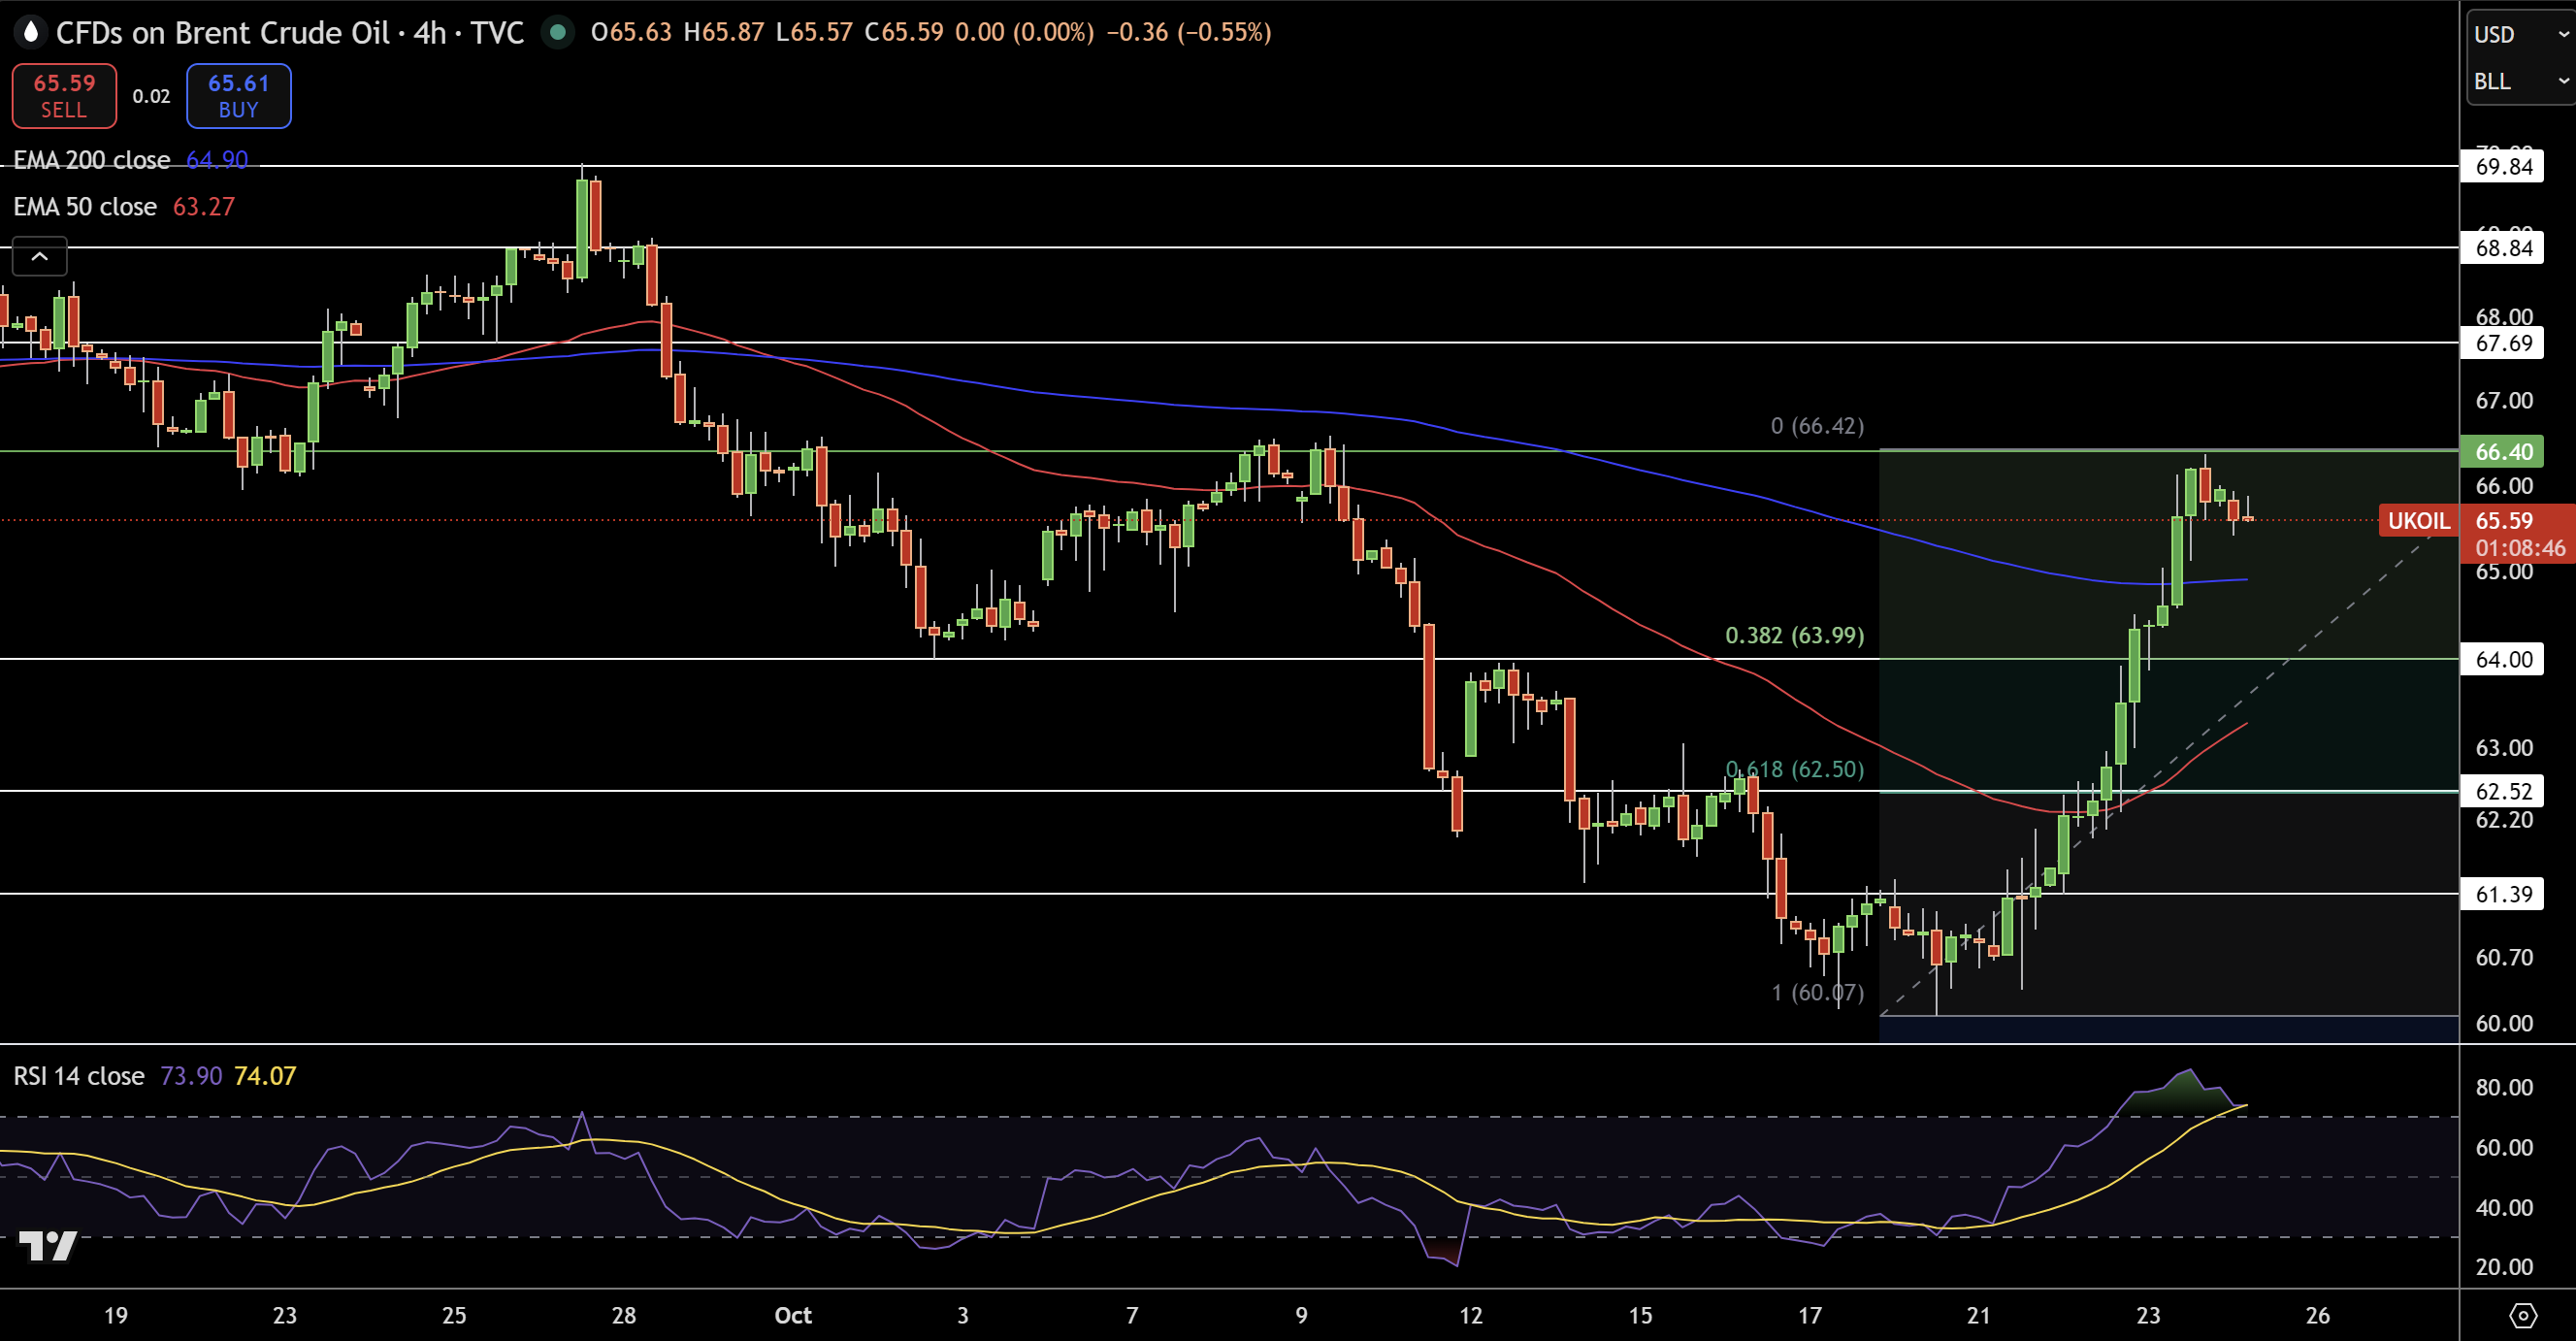
Brent crude oil is trading near $65.59 after easing slightly from its recent peak at $66.42. The price remains above both the 50-EMA ($63.27) and 200-EMA ($64.90), suggesting buyers still have control.
The RSI around 74 indicates overbought conditions, hinting at a short-term pause or correction. If prices retrace, support levels are seen near $63.99 and $62.50, aligned with key Fibonacci zones.
A decisive move above $66.50 could open the way toward $67.70, while a drop below $64.00 might trigger deeper consolidation. Overall, Brent’s uptrend remains intact, but traders may look for a mild pullback before fresh bullish momentum builds.