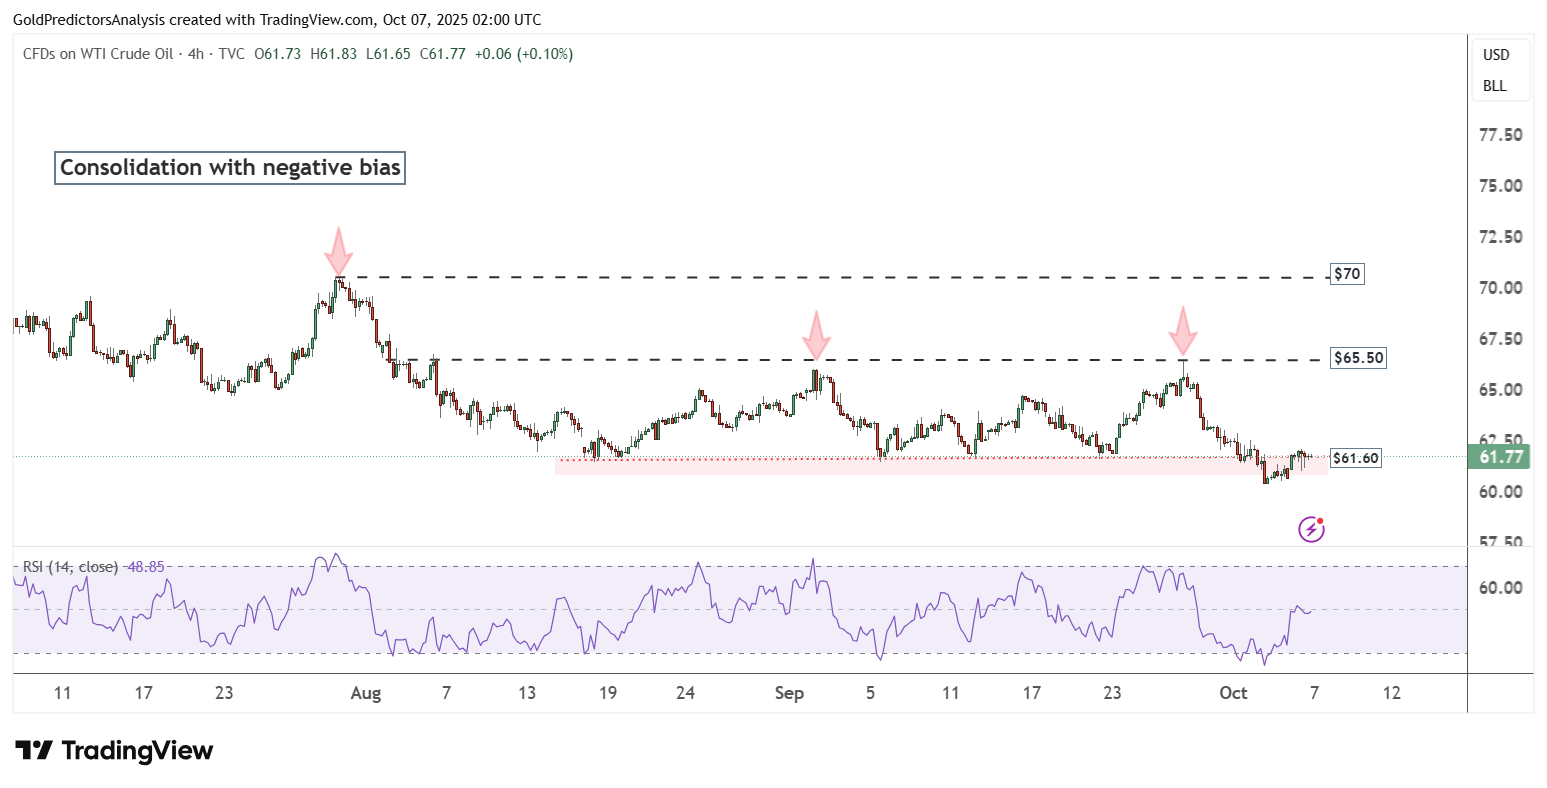



 The daily chart for WTI crude oil (CL) shows a breakdown below the $64 area, completing the ascending channel pattern and reaching the $60 level. After hitting $60, the price rebounded toward resistance at $62. Despite this bounce, WTI Crude Oil maintains a bearish outlook.
A decisive break below $60 is needed to confirm further downside pressure. As long as the price stays below the 200-day SMA at $67, the next likely move for WTI remains to the downside.
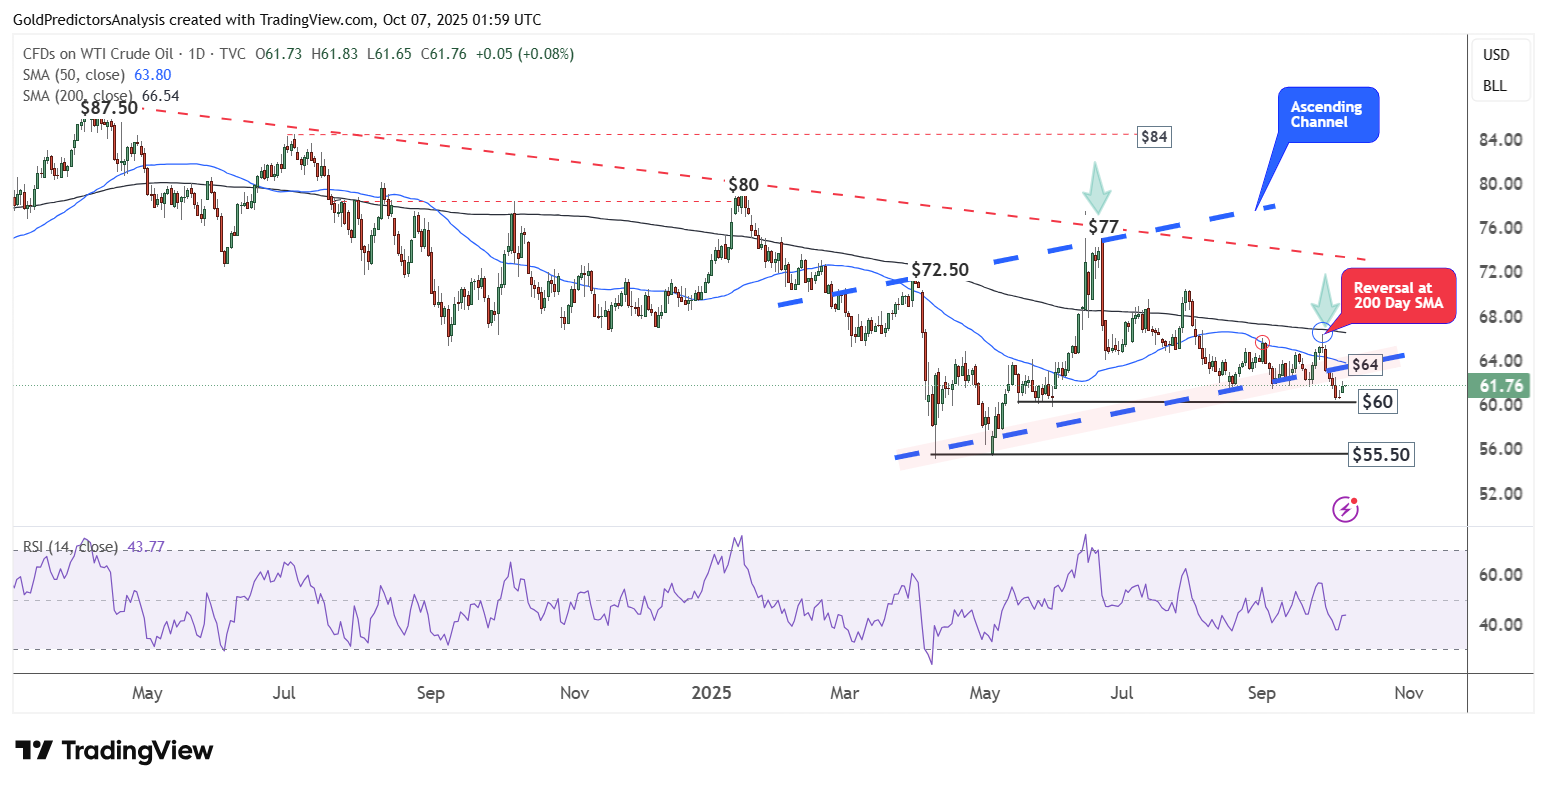
The importance of the $60 region is also evident on the weekly chart below, which shows that $60 remains the long-term support for WTI crude oil. This is highlighted by the long-term descending trendline visible in the chart.
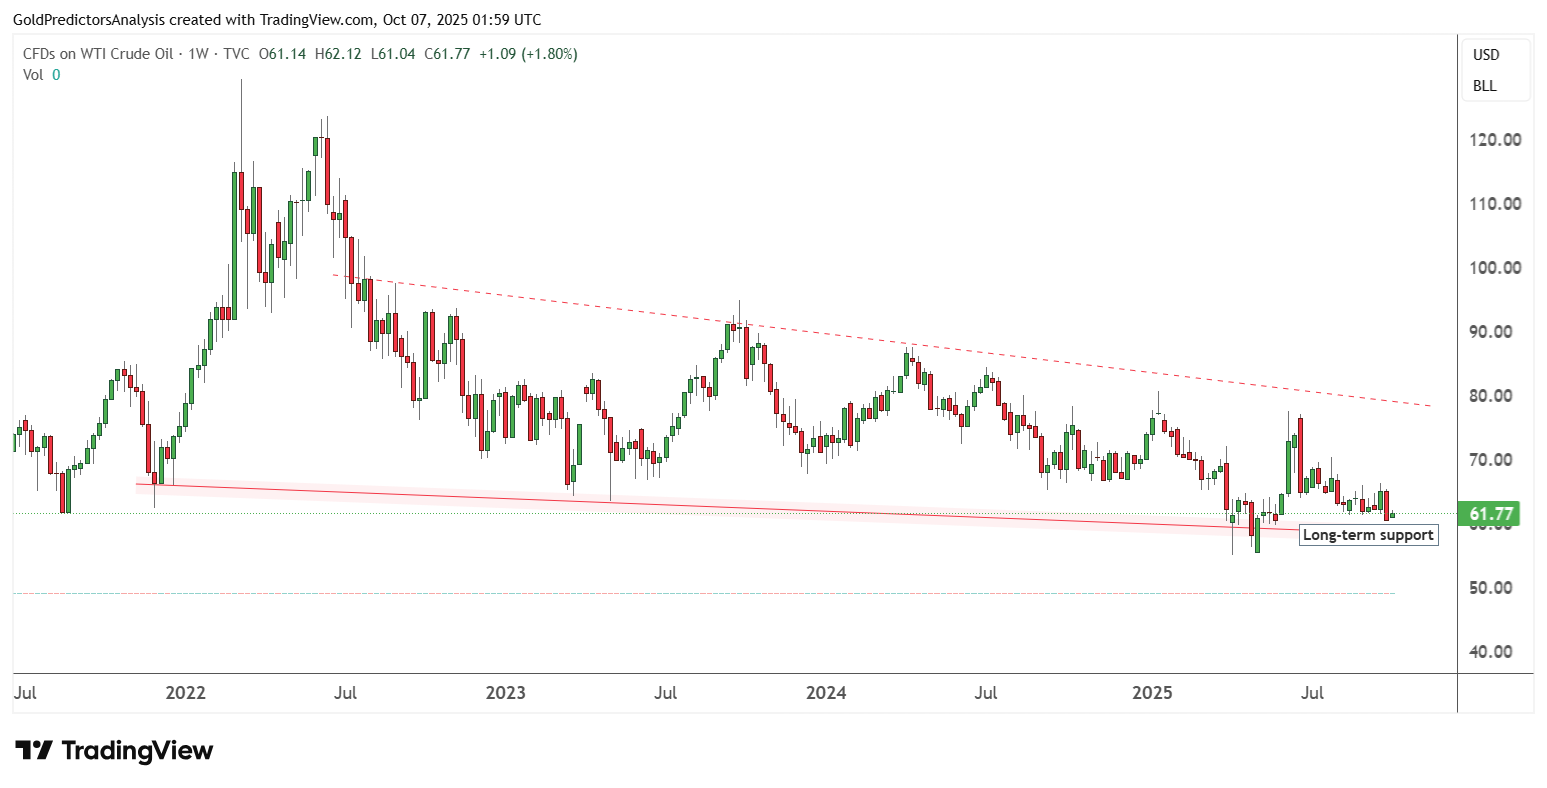
WTI Oil 4-Hour Chart – Negative Price Action
The 4-hour chart for WTI Crude Oil also shows a negative trend, with prices consolidating between the $60 and $65.50 area. The recent consolidation between $60 and $62 reflects price uncertainty as the market awaits its next move.
The RSI is holding below the mid-level, indicating persistent bearish pressure. However, a rebound in WTI Crude Oil may develop toward the $65 region before initiating the next downward move.