


 Crude oil weakened on Thursday, retreating below the 20-Day moving average for the first time in six sessions and hitting an intraday low of $63.18. This decline followed a second consecutive rejection at the 50-Day moving average after an attempted breakout of a falling wedge pattern failed. An earlier reclaim of the AVWAP indicator also proved temporary, as two intraday moves above it quickly reversed, signaling resistance.
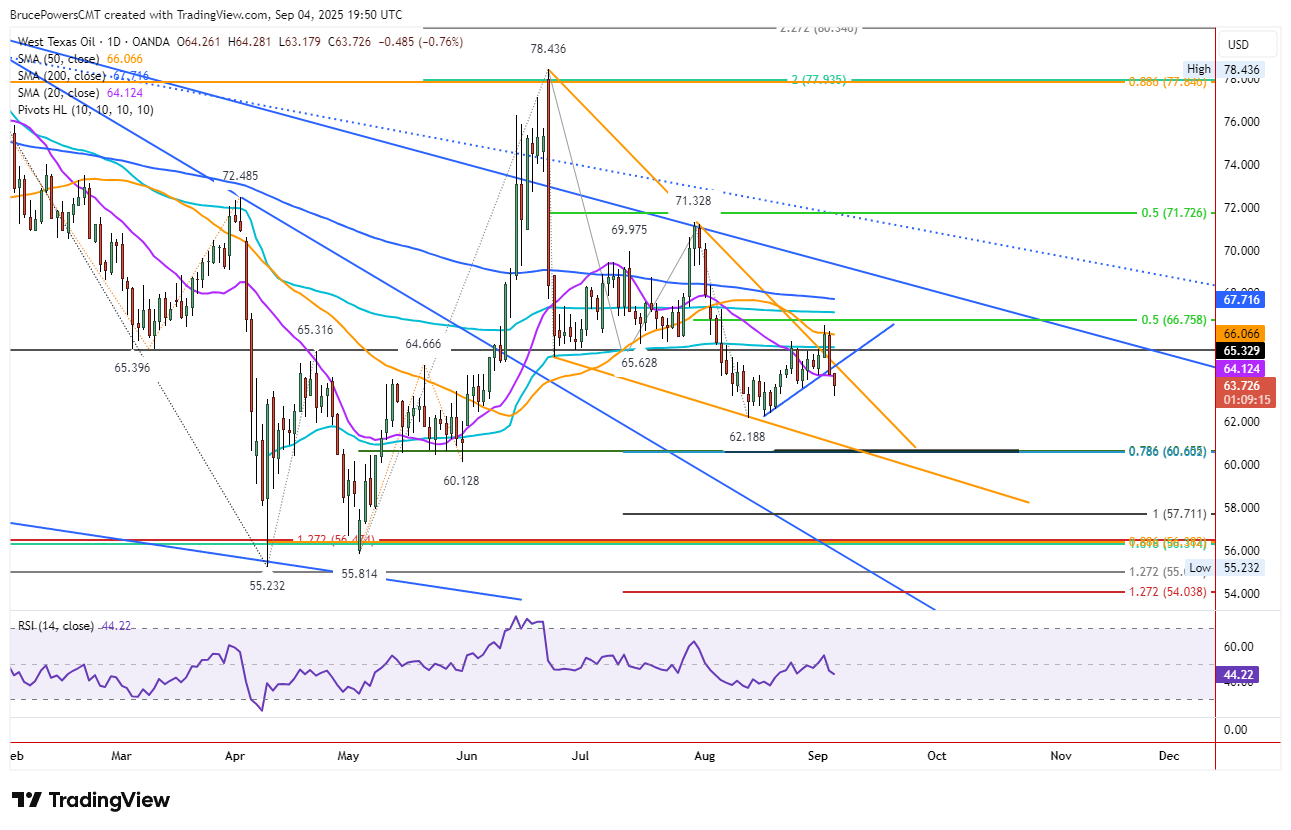
Resistance Confirms and Support Levels Break
The daily high of $64.28 aligned with resistance at the 20-Day average, while the higher swing low at $63.58 failed to hold as support. Each is a short-term bearish sign. These developments reinforce the view that crude remains in a downtrend from the June swing high. Price action continues to trace a falling wedge formation, but near-term weakness places focus on the recent swing low of $62.19. A break below this level would expose the next potential support zone near the 78.6% Fibonacci retracement at $60.66, a level that also aligns with prior consolidation support and the wedge’s lower boundary.
Weekly Chart Shows Bearish Pressure
On the weekly timeframe, crude has formed a bearish outside reversal pattern that will be confirmed on a weekly close below last week’s low of $65.58. Current price action suggests the week could finish in the lower third of the trading range, underscoring downside momentum. The 20-Week moving average, now at $65.29, remains a significant level of resistance. Multiple failed attempts to reclaim it highlight the strength of overhead supply.


