


 Crude oil remained under pressure on Tuesday, holding near recent lows of $63.21 for the third consecutive session. Sellers kept control throughout the day, with activity establishing a lower daily high and possibly a lower daily low. At the time of writing, crude was trading close to session lows, leaving the door open for further weakness before the end of the day’s session. Over the past three days, the market has been consolidating in a narrow range near these lows, reflecting indecision but also an inability for buyers to generate any meaningful upside momentum.
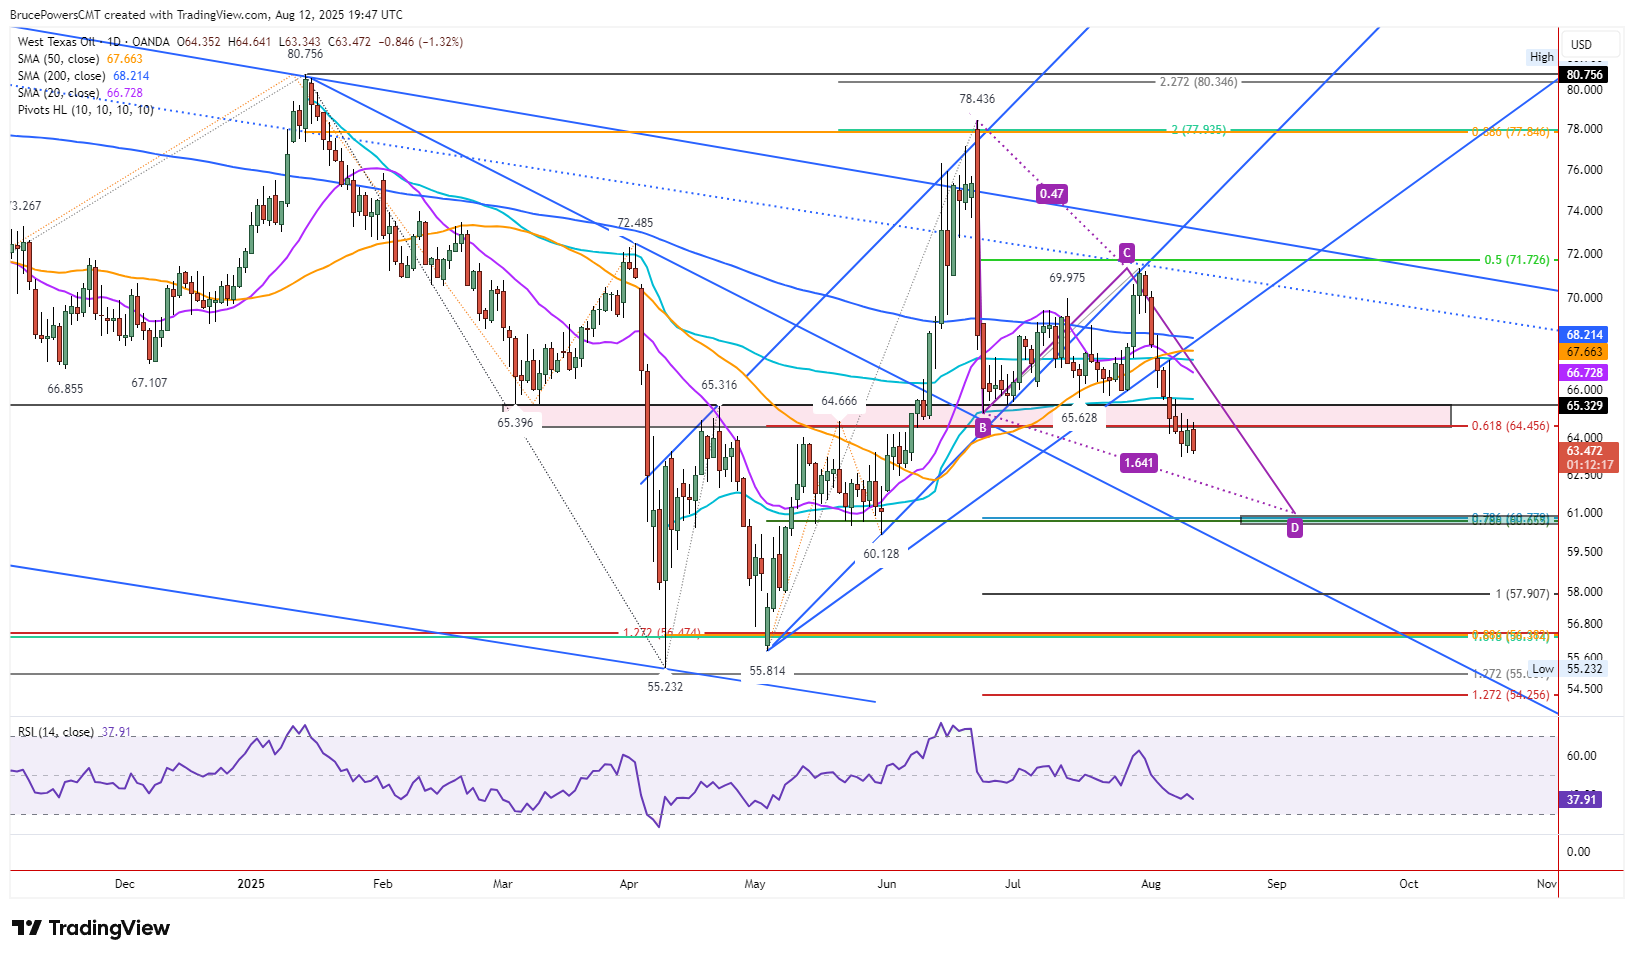
Below Key Fibonacci Support Zone
This latest consolidation has developed mostly beneath a previously noted potential support area that ends at the 61.8% Fibonacci retracement level of $64.47. Trading below this zone reflects the market’s inability to reclaim a critical threshold that often signals a potential reversal in price direction. A decisive break under $63.21 would confirm a bearish continuation signal and open the path toward the next support level near the 78.6% Fibonacci retracement at $60.66.
This zone gains added importance as it aligns with a 78.6% projected target from a falling ABCD pattern, which identifies a completion level near $60.79. The confluence of these two technical measures reinforces the probability of a test of that area if current weakness continues.
Technical Damage and Resistance Levels
Recent declines have caused substantial technical damage. Crude has fallen below the long-term trendline, the 50-day and 20-day moving averages, and a key anchored volume-weighted average price (AVWAP) level from a significant low, now positioned at $65.59. These broken dynamic support lines are now likely to serve as resistance. Until price can rally back above $65.58, there is little technical evidence to suggest that current weakness is reversing.


