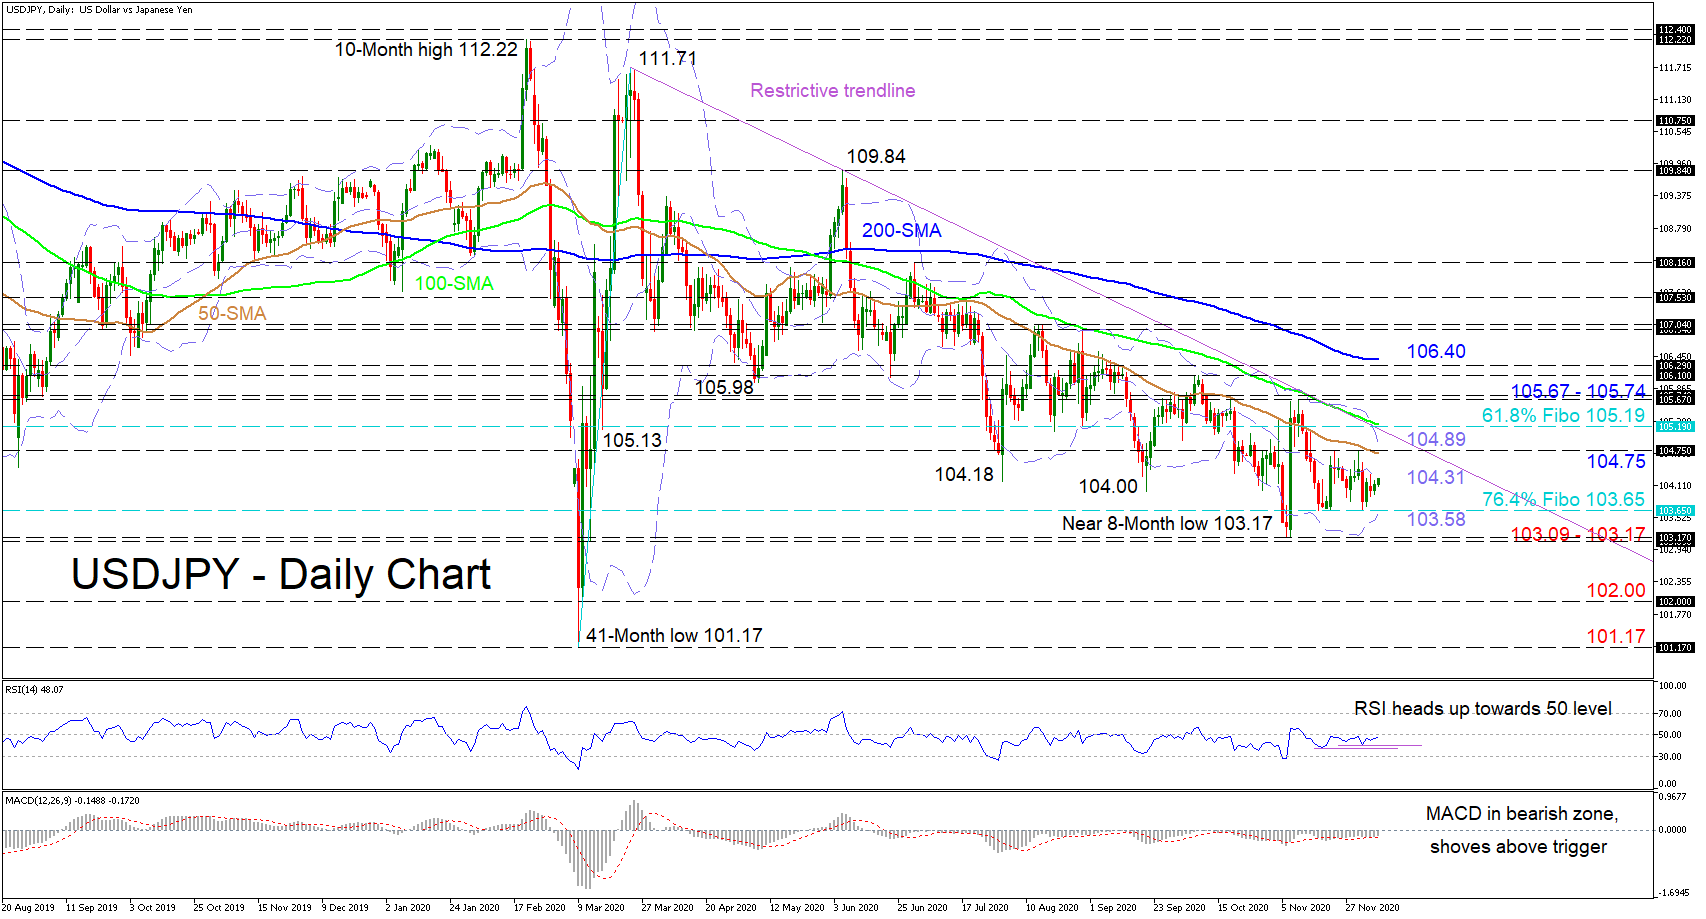
 USDJPY is tackling the mid-Bollinger band at 104.31 as a sideways move confines the pair between the 103.65 level, which happens to be the 76.4% Fibonacci retracement of the up leg from 101.17 to 111.71, and the 104.75 highs. Nonetheless, the simple moving averages (SMAs) continue to exhibit the broader negative bias.
The short-term oscillators are reflecting slight improvements in positive momentum with the MACD, in the negative region, creeping above the red trigger line, while the gradual hike in the RSI nudges it closer to the 50 mark.
Buyers could face congested obstacles pushing above the mid-Bollinger band at 104.31, starting with resistance from the 50-day SMA, currently attached to the 104.75 barrier. Next, the upper Bollinger band at 104.89 may impede the price from testing the restrictive trend line pulled from the 111.71 peak. Breaking above this, the nearby 100-day SMA, residing at the 61.8% Fibo of 105.19, may try to terminate the climb towards the 105.67-105.74 resistance section.
If sellers resurface and steer the price down, support may originate from the neighbouring lows at the 103.65 level that corresponds with the 76.4% Fibo. Marginally beneath this level, the lower Bollinger band at 103.58 may hinder the pair from reaching the critical support base of 103.09-103.17. However, should the bears persevere and cause steeper declines, the price may sink towards the 102.00 round number, coinciding with the low of March 10, before their focus aims for the 41-month low of 101.17.
Summarizing, USDJPY in the short-term appears to be trapped amongst the 103.09 and 105.74 boundaries. Currently under the descending line, a move below 103.65 or above 104.89 could indicate the next price course.

Origin: XM


