


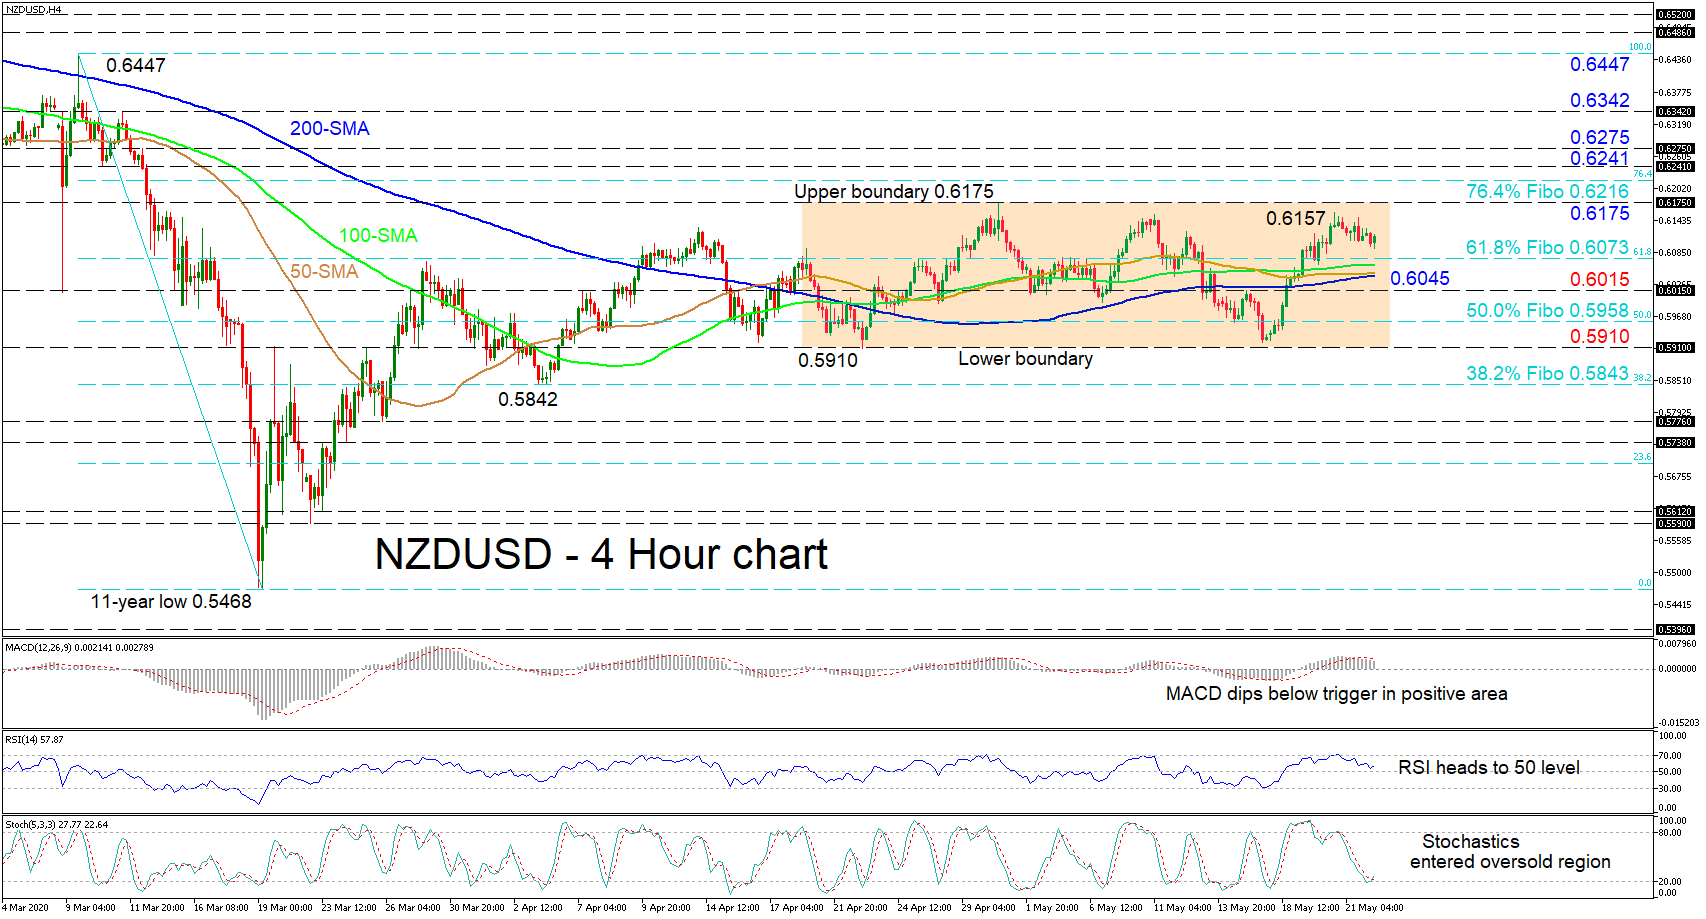
 NZDUSD appears to be fading from the vicinity of the upper boundary of the range of 0.6175 towards the 0.6073 level, that being the 61.8% Fibonacci retracement of the down leg from 0.6447 to the 11-year low of 0.5468, and the converged simple moving averages (SMAs) beneath.
The short-term oscillators display the weakening in positive momentum. Yet, a pickup in bullish momentum cannot be ruled out for now, as the RSI in the positive area has turned back up ahead of its neutral threshold, while the stochastic lines seem to be pivoting at the 20 mark. Moreover, the MACD is holding just below its red signal line in the positive section.
Should buying interest pick up, initial friction could emerge from the 0.6157 nearby high ahead of the restricting upper boundary of the range at 0.6175. Overrunning this border, the 76.4% Fibo of 0.6216 could test buyers’ efforts to ascend further. If the 0.6241 to 0.6275 section fails to halt the push up, the price may stretch towards the 0.6342 high and the 0.6447 peak of March 9.
Otherwise, if the dive southwards manages to push past the 61.8% Fibo of 0.6073 and the key region of flattened SMAs, the 0.6015 obstacle could come into focus. Extending lower, the price may encounter the 50.0% Fibo of 0.5958 ahead of the tough base of the consolidation pattern at 0.5910. A successful violation of this border could send the pair to the 38.2% Fibo of 0.5843 coinciding with the important trough of 0.5842 from April 3.
Summarizing, the positive outlook is intact above 0.5910. That said, a shift above 0.6447 would cement a neutral picture in the medium-term and see a neutral-to-bullish bias return in the short-term timeframe.
Origin: XM


