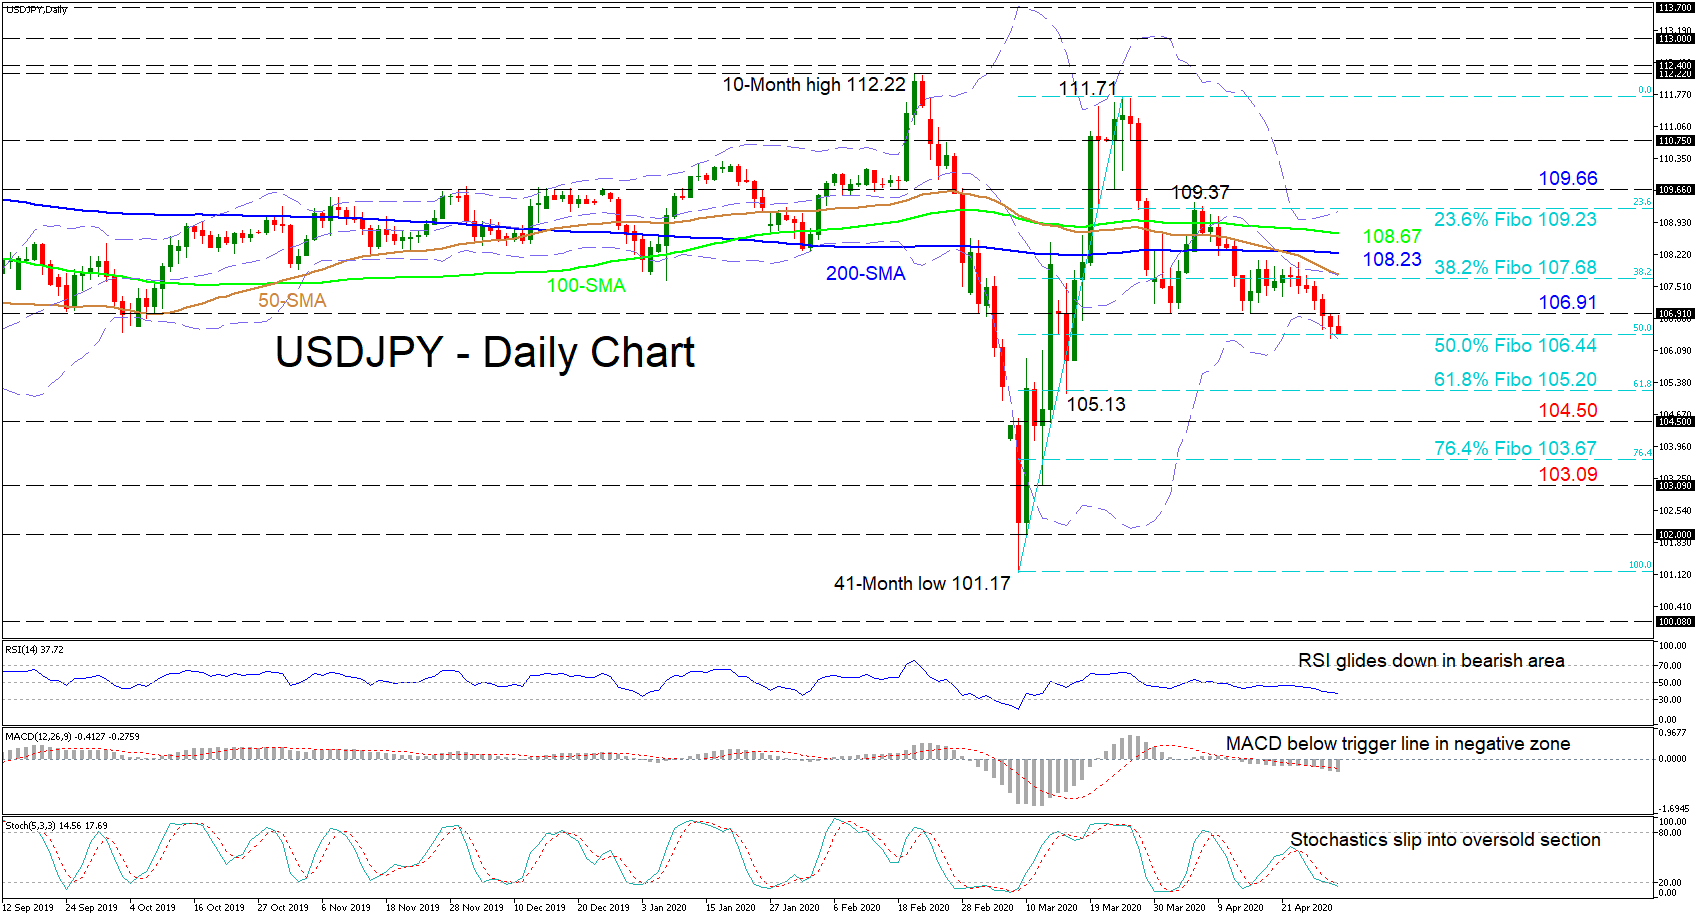
 USDJPY has lost extra ground past the lows of 106.91 after having failed to overcome the mid-Bollinger band last week. Presently the price is resting at the 106.44 level, that being the 50.0% Fibonacci retracement of the up leg from the 41-month low of 101.17 to the 111.71 high and where the lower Bollinger band is located.
The short-term oscillators appear to be confirming the new-found negative move within the price as does the downward sloping 50-day simple moving average (SMA). The RSI has adopted a gradual decline within the bearish territory, while the MACD, in the negative zone, has restarted its fall below its red trigger line. Additionally, the stochastic lines have dipped into the oversold region and maintain a negative tone for now.
In the bearish scenario, immediate constraints could come from the 50.0% Fibo of 106.44 coupled with the mid-Bollinger band, a violation of which may drop the pair to meet the 61.8% Fibo of 105.20, near the key swing low of 105.13. Deeper declines could then test the 104.50 support ahead of the 76.4% Fibo of 103.67. If the bears endure, they may then be challenge by the trough of 103.09.
To the upside, initial resistance could come from the 106.91 level before a tough maze of limiting obstacles. Starting from the 38.2% Fibo’s area of 107.68 fortified by the dipping 50-day SMA and the mid-Bollinger band. Once this is overcome, buyers face two mostly flat SMAs, the 200-day at 108.23 and the 100-day one at 108.67. Conquering these, the upper Bollinger band and the 109.37 peak – residing in the 23.6% Fibo’s vicinity of 109.23 – could apply the brakes ahead of the 109.66 barrier.
Overall, the very short-term picture looks neutral-to-bearish and a break below 106.44 would reinforce the bearish outlook.
Origin: XM