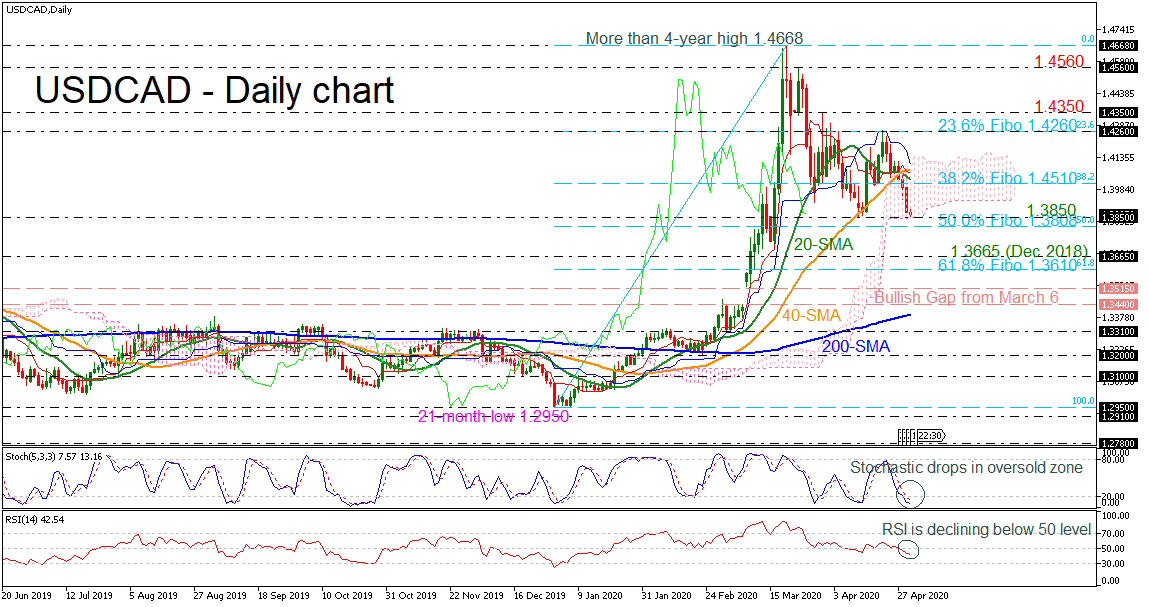
 USDCAD came close to ending the day near the 1.3850 support level, near the lower surface of the Ichimoku cloud, posting a strong sell-off session. This movement drove the simple moving averages (SMAs) to complete a bearish crossover in the short-term, and the technical indicators to head sharply lower. The stochastic is hovering in the oversold zone, while the RSI indicator is diving in the negative territory.
A stronger downside movement could see immediate support of the 50.0% Fibonacci retracement level of the up leg from 1.2950 to 1.4668 near 1.3808. Below that, the inside swing high of 1.3665, taken from December 2018 could attract traders’ attention before challenging the 61.8% Fibonacci of 1.3610. If the price slips beneath this line, it could recoup the bullish gap from March 6.
On the flip side, a rebound on the 1.3850 support level, could send prices towards the 38.2% Fibo of 1.4510, which stands near the 20-day SMA. Above that, the upper surface of the Ichimoku cloud is coming next, testing the 1.4145 number. Even higher, the 23.6% Fibo of 1.4260 – which encapsulates the latest high – could be in focus.
Overall, looking at the short-term, the price has been in a sideways move of 1.3850-1.4260 over the past month but in the broader picture the outlook remains bullish.
Origin: XM