


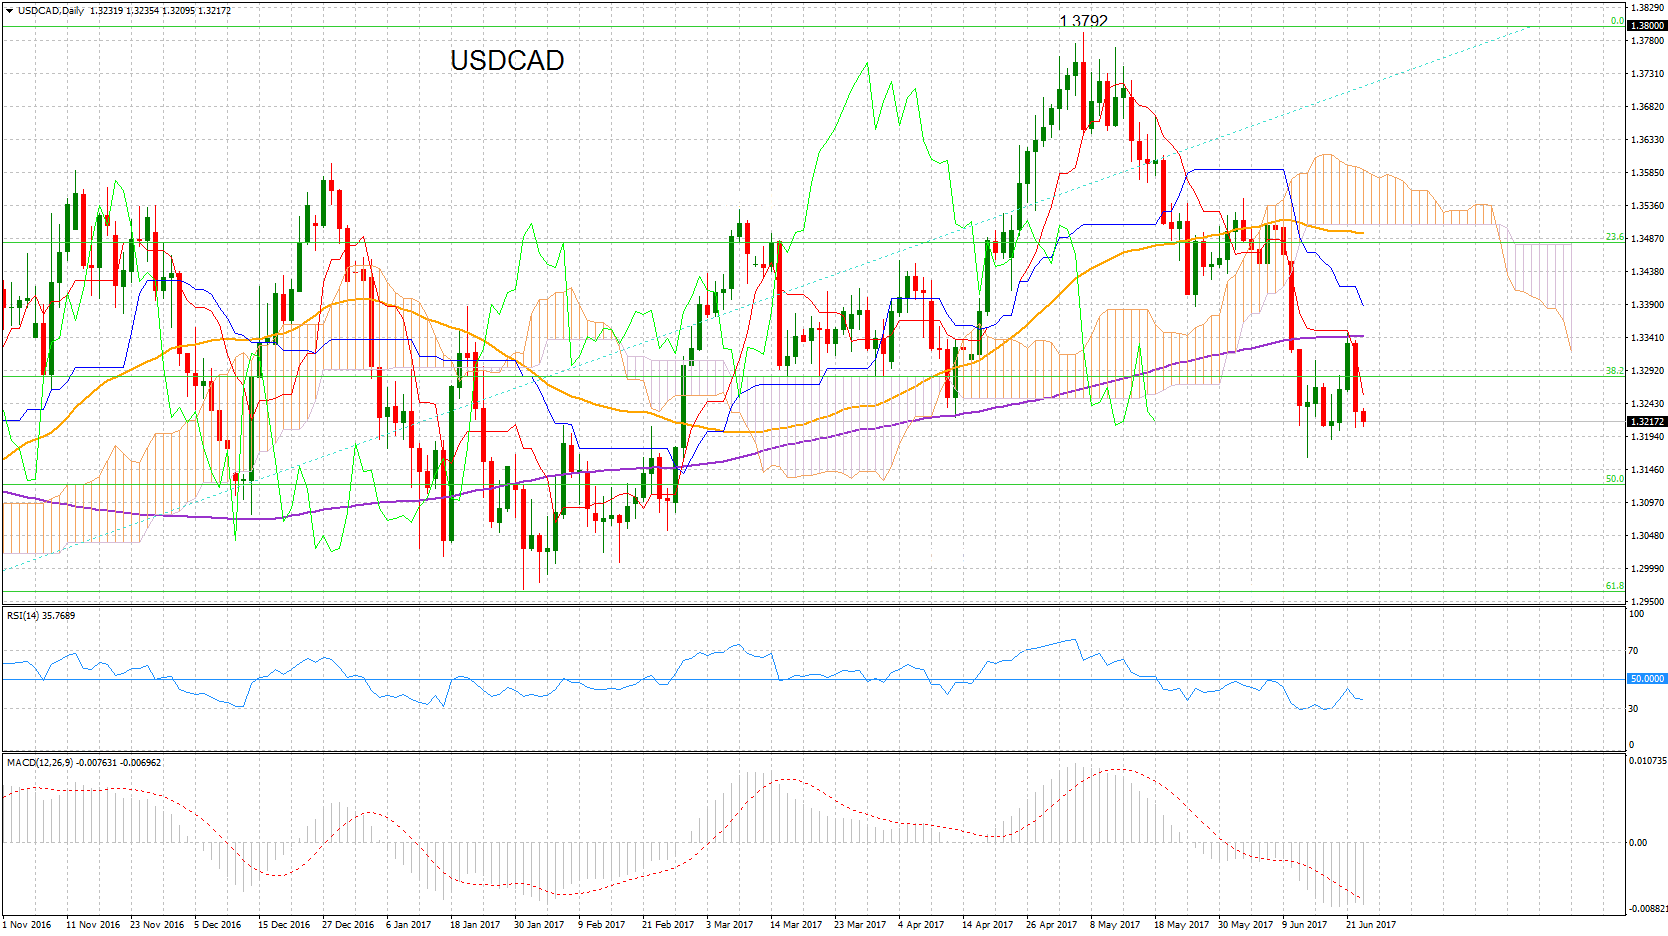
 USDCAD has been in a downtrend since falling from the May 5 high of 1.3792. There is risk to the downside since the momentum indicators are bearish. RSI is below 50 and MACD is below zero and trending down.
Other bearish signals were given when the tenkan-sen crossed below the kijun-sen on May 24. Trend indicators are also showing a bearish picture, as the market is below the Ichimoku cloud and below the 200-day moving average.
Major resistance is now being provided by this 200-day MA at 1.3342. A sustained break above this would start to weaken the downside bias and prices would target the base of the cloud at 1.3507. From here prices would move into the cloud. Rising above the cloud top at 1.3612 would negate the bearish bias.
Immediate support is at the June 14 low of 1.3163 and a fall below this level would target the January 31 low of 1.2968.
In the bigger picture, staying within the range of 1.3000 and 1.3600 would keep a neutral bias for the medium-term.
Origin: XM


