 WTI Oil Daily Chart – Rebound
The daily chart for WTI Crude Oil shows that the price has bounced from long-term support. It has since moved up and reached the $60 area. A breakout above this level could push prices toward the next resistance zone around $62–$64. However, as long as the price stays below the $66 region, WTI remains in a broad consolidation phase with limited upside momentum.
The strong rebound in WTI crude oil is clearly visible on the weekly chart. The chart highlights a key long-term support zone near the $55 region. Immediate resistance stands around the $66 area. A breakout above this level could push prices toward the long-term resistance near $75. Conversely, a break below $55 would signal renewed downside pressure and potentially trigger a deeper selloff in the oil market.
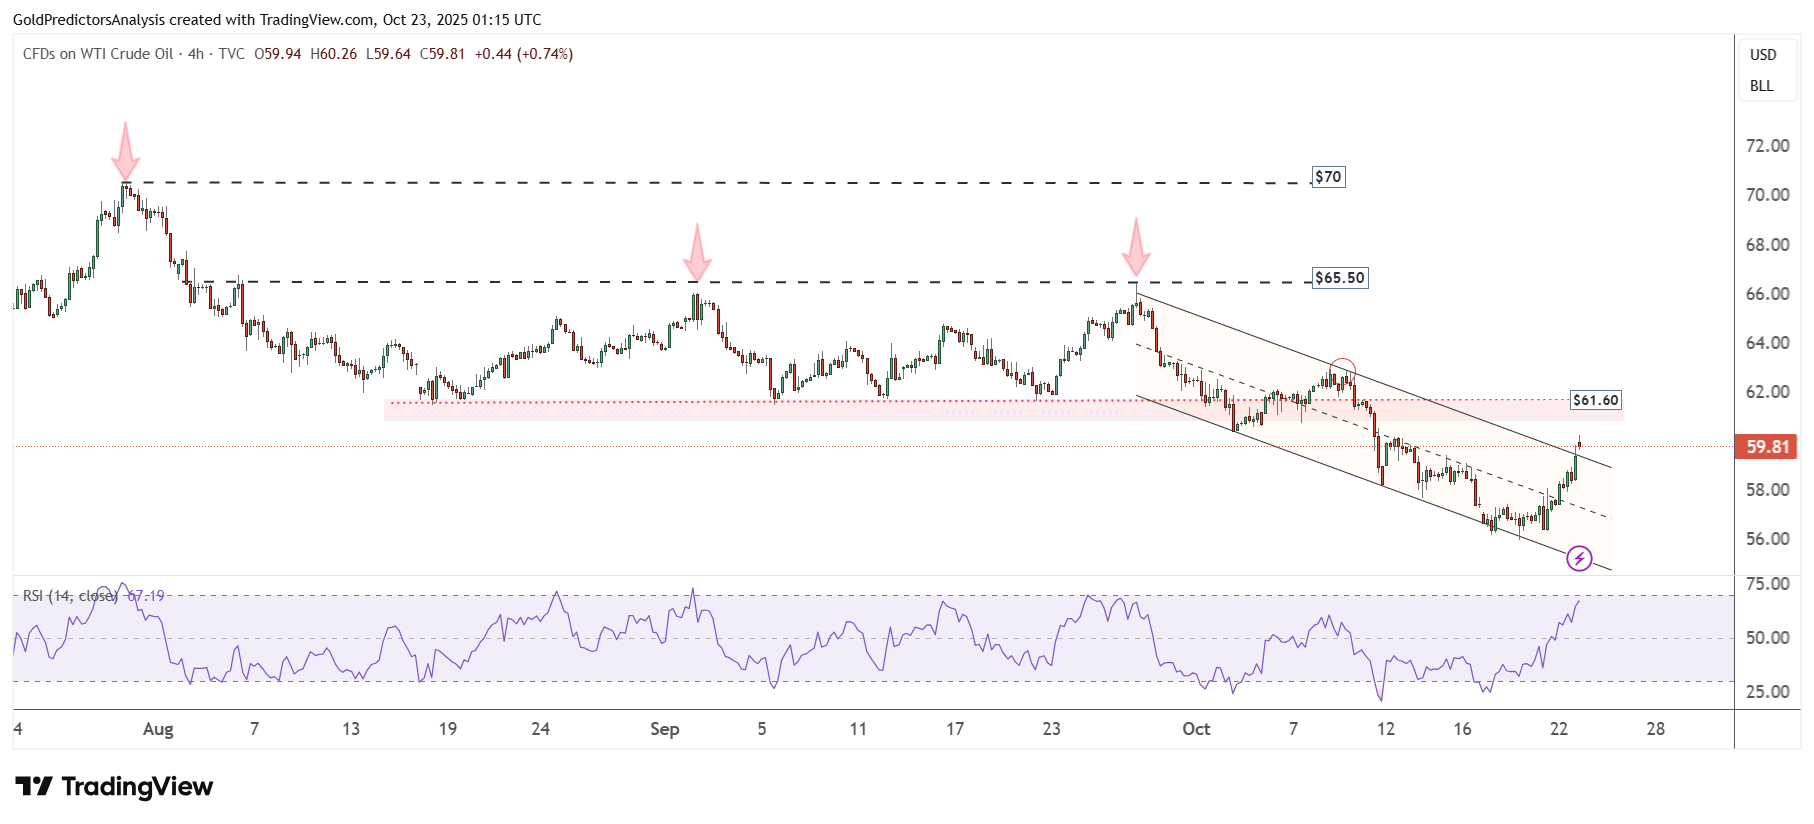
WTI Oil 4-Hour Chart – Descending Channel
The 4-hour chart for WTI Crude Oil shows that the price has rebounded from the $55 region and broken out of the descending channel pattern. This breakout suggests that the price may move toward the $62 resistance area. A clear break above $62 could push the price further toward the $65.50 level.