


 Crude oil ignited a one-day bullish reversal on Tuesday, climbing to a high of $58.51 through a hammer candlestick pattern. Monday’s low of $56.41 marked an 88.6% Fibonacci retracement of the prior full advance, aligning with the upper edge of a key support zone tied to spring’s $55.23 double bottom. As of now, trading sits below yesterday’s $57.90 high, requiring a close above it to confirm the hammer breakout and signal growing demand.
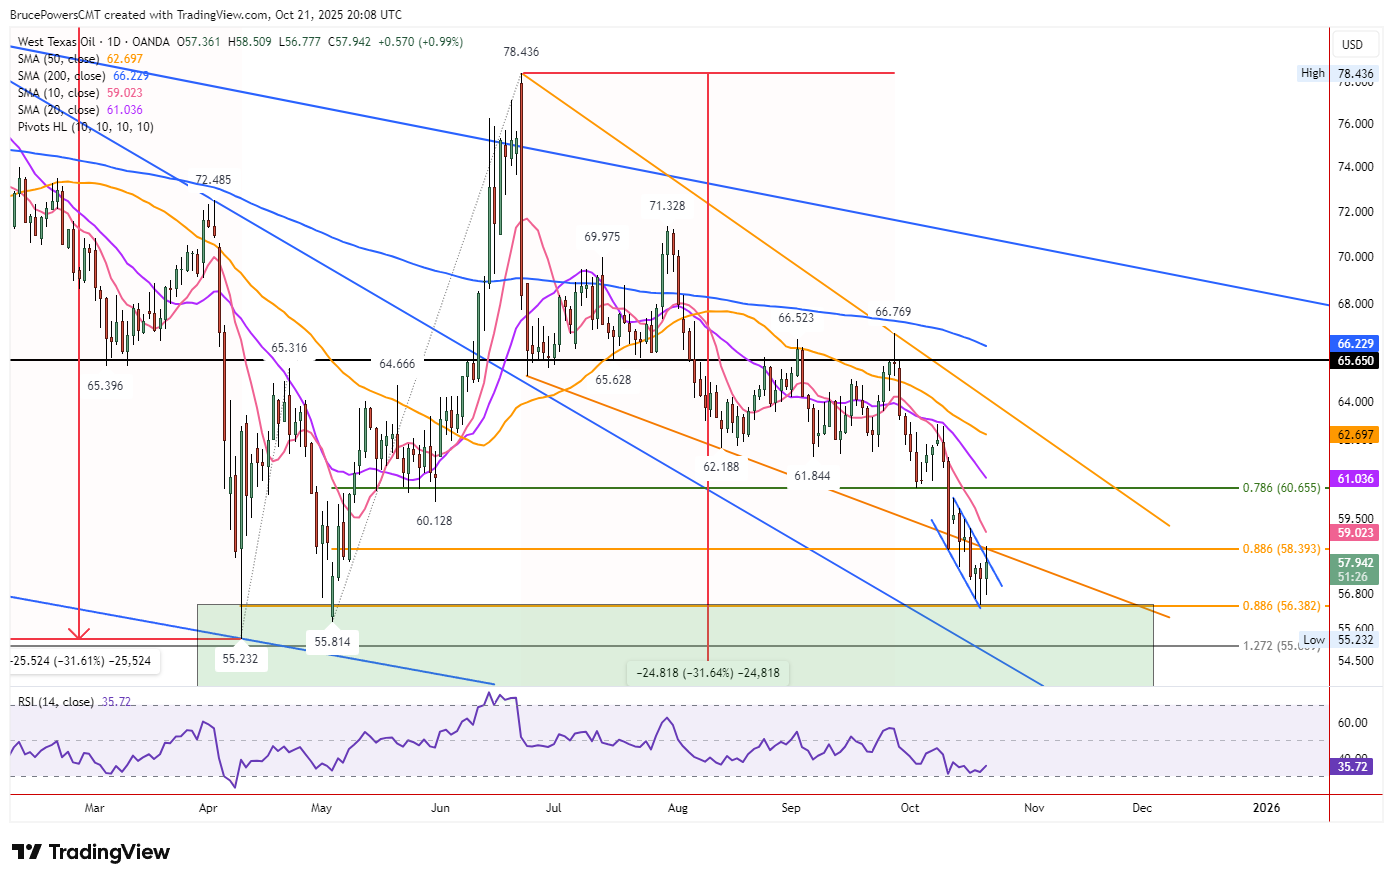
Resistance Tests Loom
The falling 10-day moving average at $59.00 stands as the first dynamic resistance. Its recent history calls for confirmation from other indicators. Today’s high tested a prior support level as resistance, which held firm, alongside the lower boundary of a former falling bull wedge—both hinting buyers haven’t fully seized control. A retest of $56.41 remains possible absent a breakout above today’s high.
Falling Wedge Breakout Potential
Since the sharp October 10 decline, crude has traced a small falling wedge pattern, characteristic of declining consolidation. A confirmed bullish reversal could drive a rapid advance, targeting the wedge’s top at $60.28, followed by the prior $60.64 low (also a 78.6% Fibonacci retracement). The falling 20-day average at $61.03, nearing this level, adds significance; it rejected an early October swing high and may do so again.


