 WTI Oil Daily Chart – Bearish Pressure
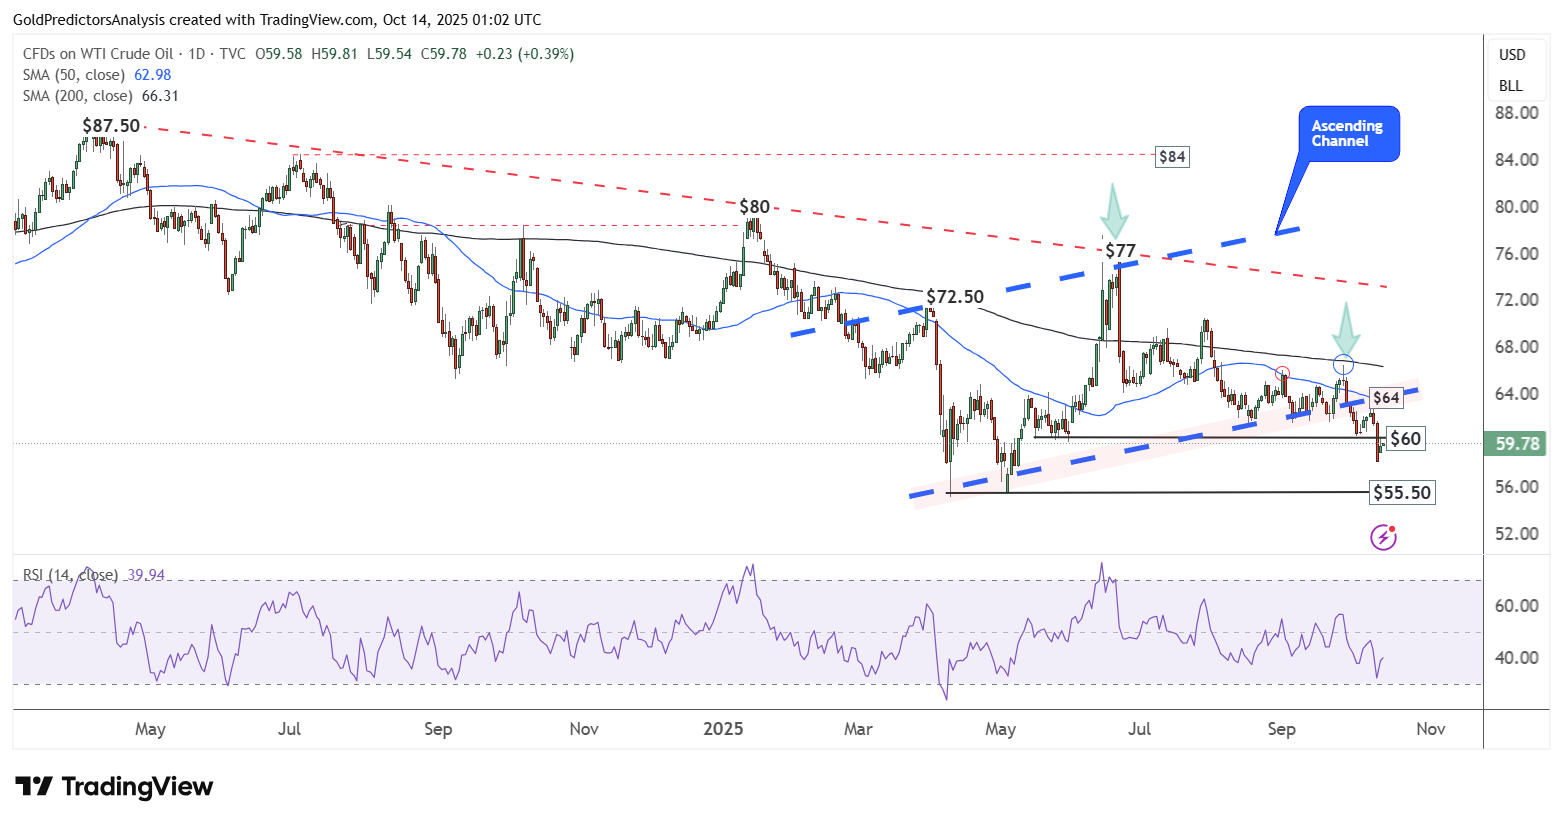
The daily chart for WTI crude oil shows that the price has broken below the ascending channel pattern near the $64 area and continues to move lower.
A break below $60 has triggered renewed selling pressure. This pressure may push prices toward the $55.50 level. The 50-day SMA remains below the 200-day SMA, indicating further downside potential in the coming days and weeks.
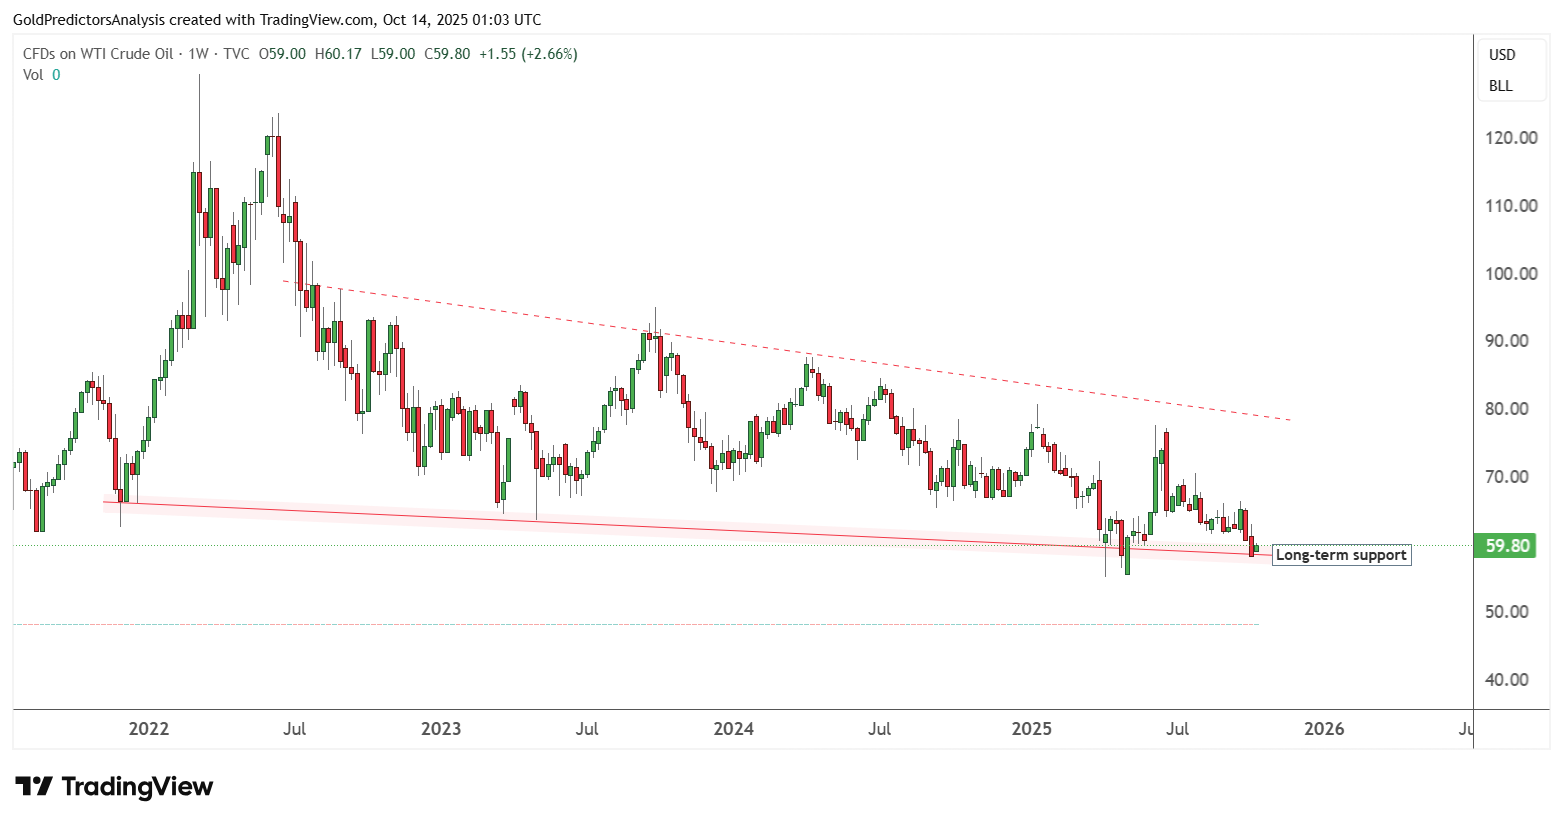
Despite the breakout seen on the daily chart at $60, the long-term weekly chart below shows that oil prices remain within a significant support zone. A decisive breakout will occur only if the price falls below the $55 level. A break below this area could trigger intense selling pressure in oil prices.
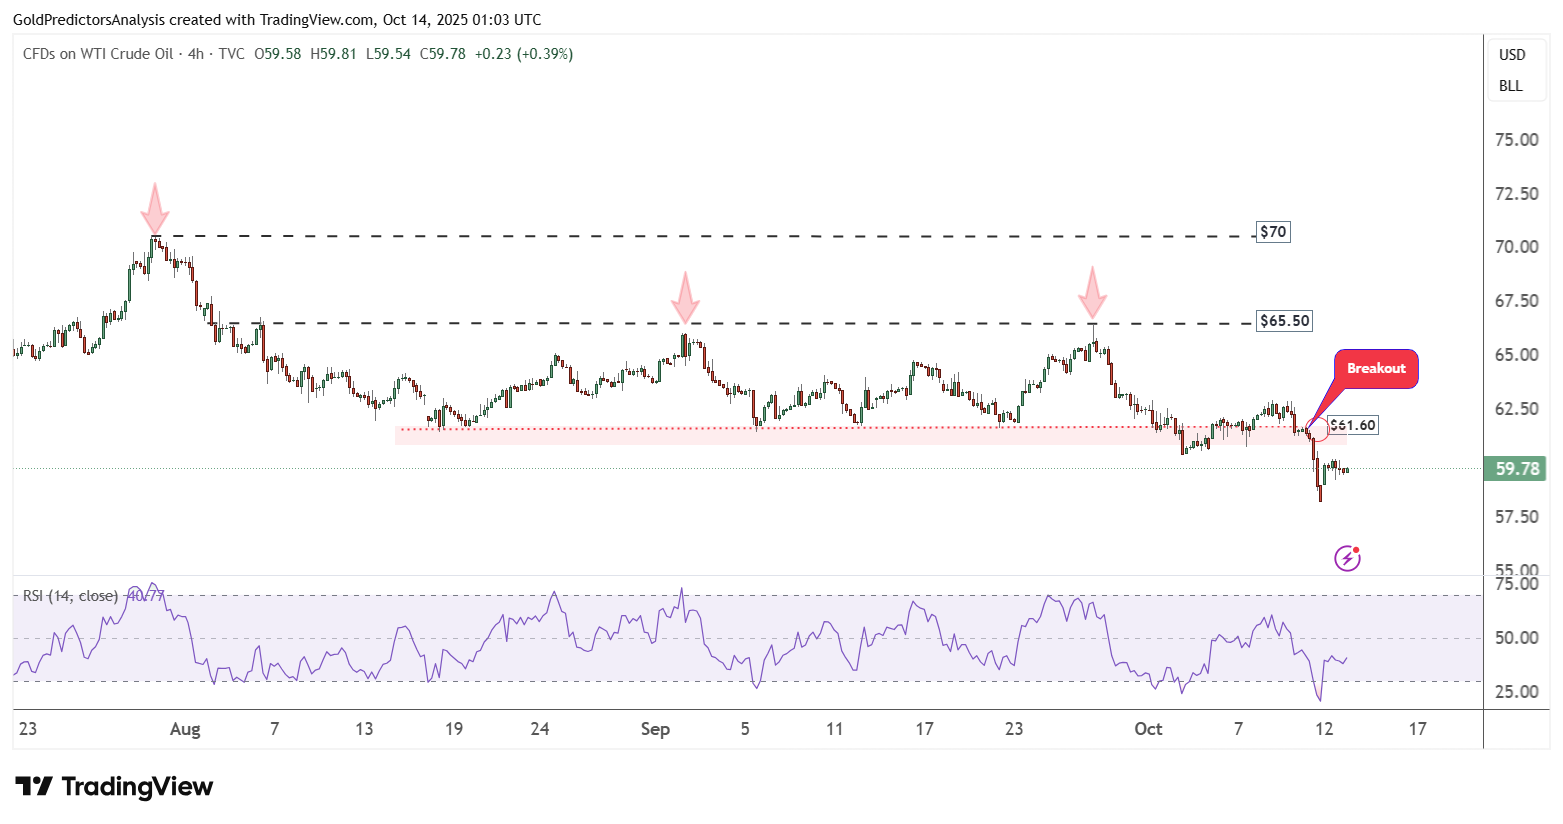
WTI Oil 4-Hour Chart – Negative Price Action
The 4-hour chart for WTI crude oil shows that the price failed to break above the $65.50 level and has fallen below $61.60, indicating a strong breakout to the downside and renewed selling pressure in oil prices.