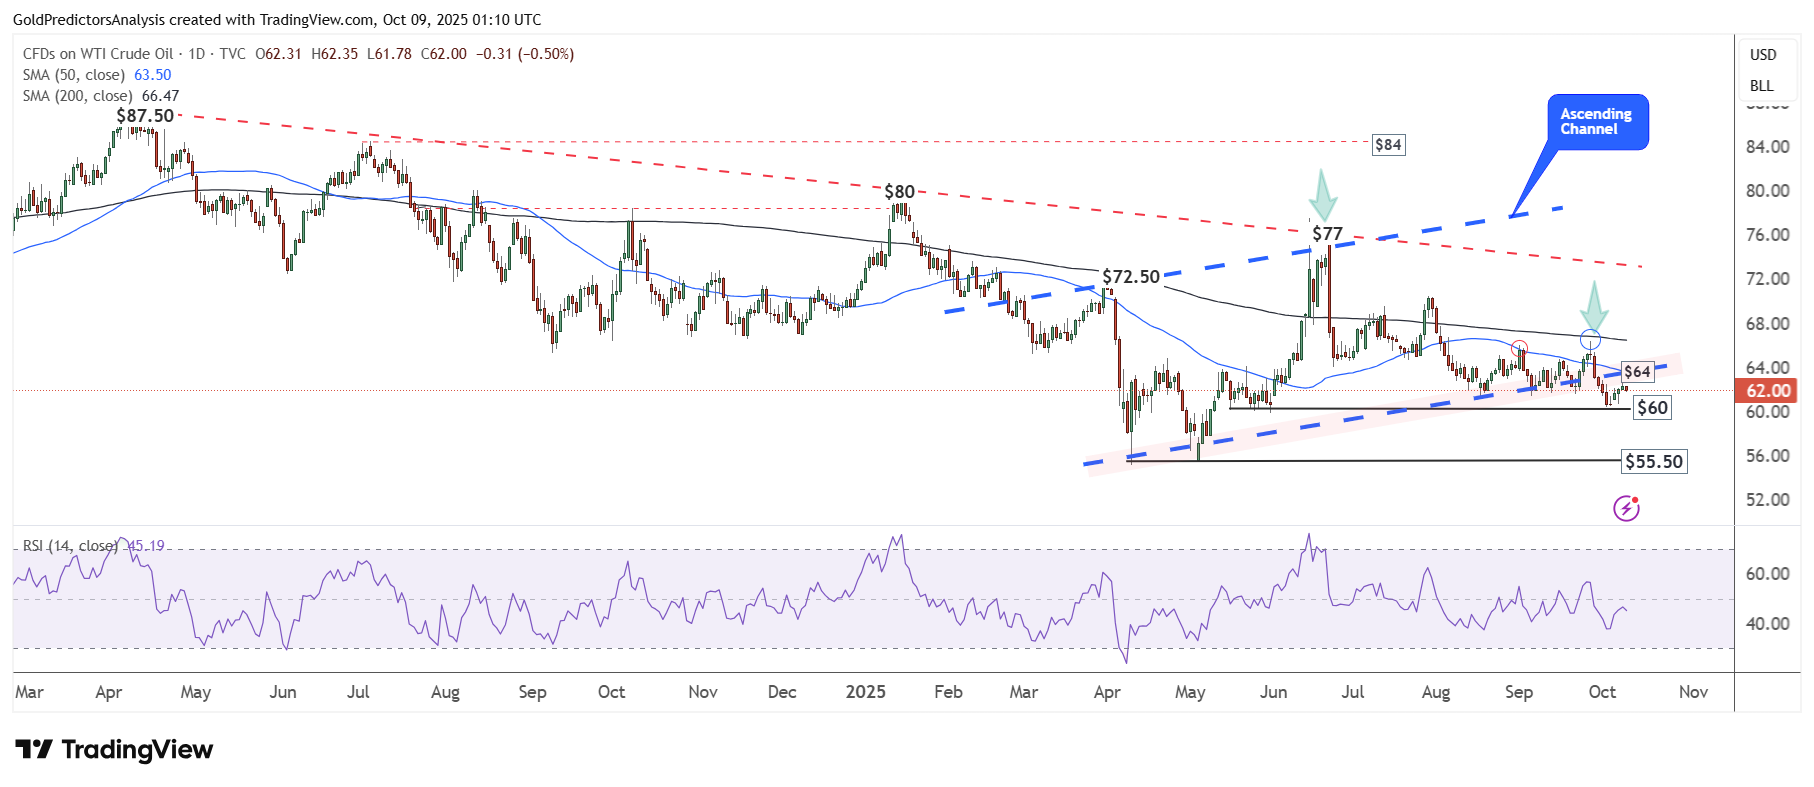
 The daily chart for WTI crude oil shows a rebound from long-term support at the $60 level, with prices moving toward the $64 area. This $64 region serves as key resistance, aligning with the 50-day SMA and the upper boundary of the ascending channel pattern.
A breakout above $64 could push prices higher toward the $67 zone, while a break below $60 may trigger further downside toward $55.50. Overall, oil prices remain uncertain and continue to consolidate within the tight $60–$70 range, awaiting a decisive move.
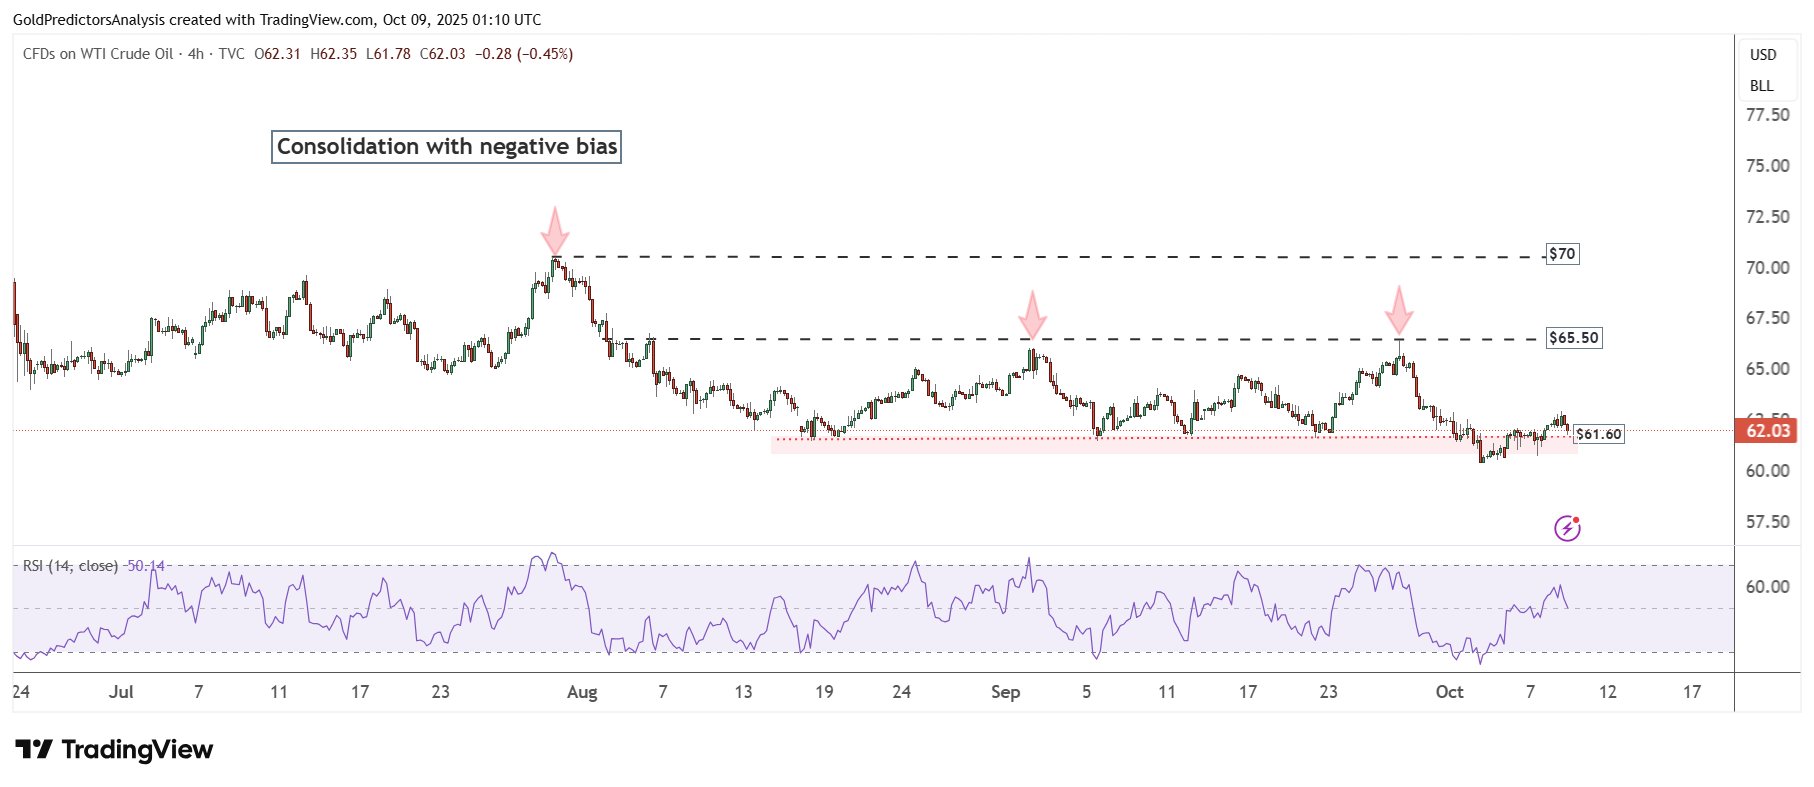
WTI Oil 4-Hour Chart – Negative Price Action
The 4-hour chart for WTI crude oil shows a rebound from the critical support zone between $60 and $61. This critical support zone is highlighted in red. Strong resistance remains at the $65.50 level. However, a breakout above this level could push the trend toward the $70 area. On the other hand, a break below $60 would be needed to trigger further downside in oil prices.