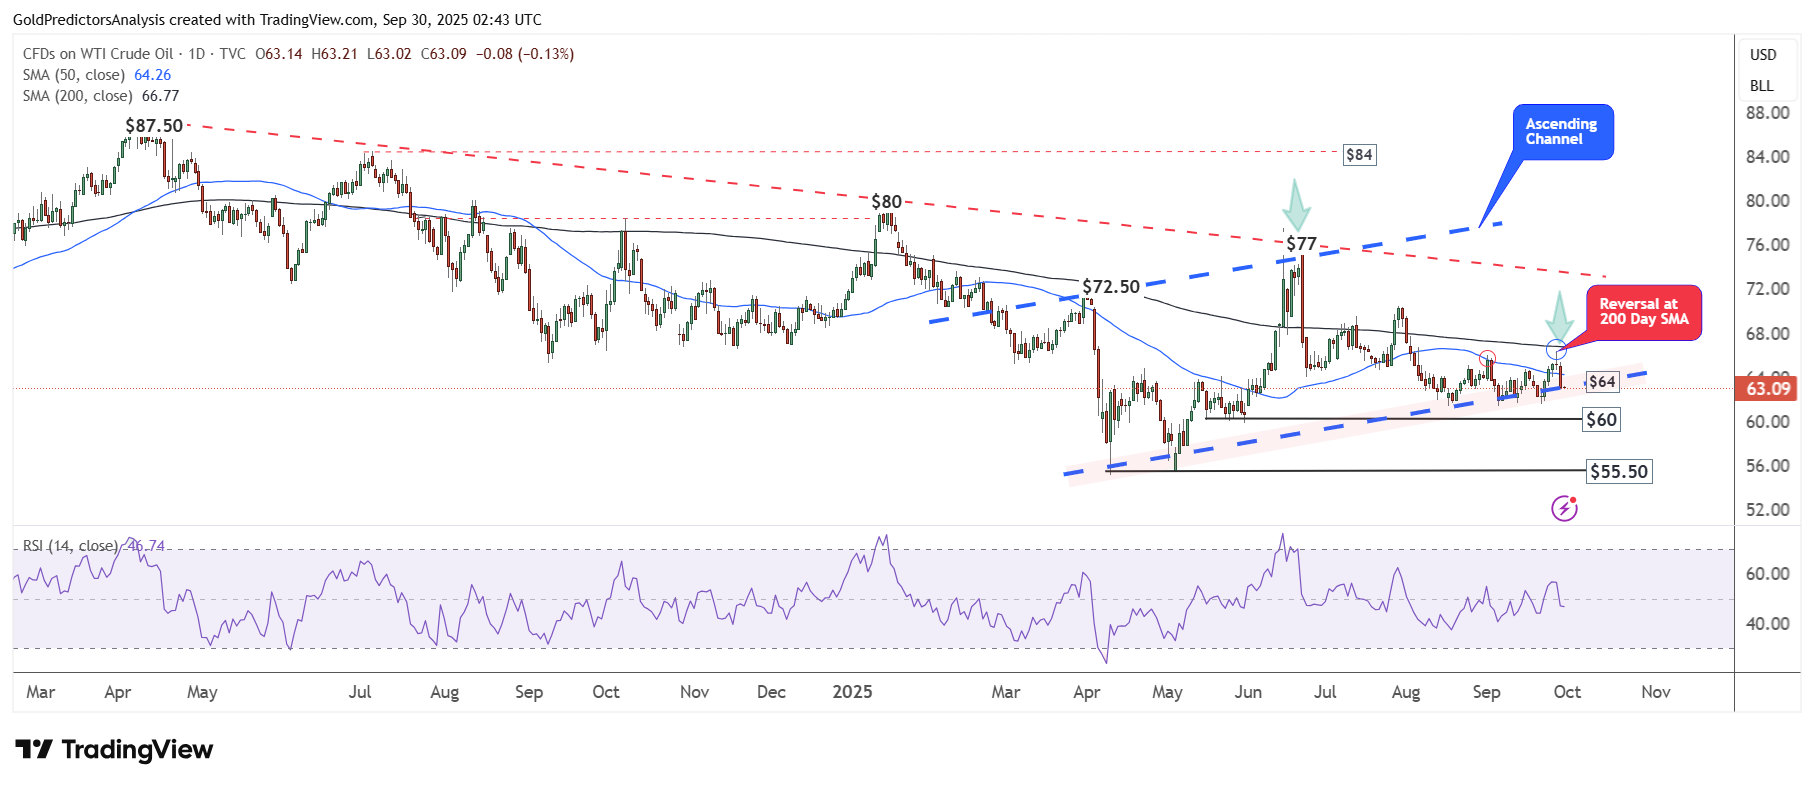
 WTI Oil Daily Chart – Bearish Pressure
The daily chart for WTI crude oil (CL) shows that the price was rejected at the 200-day SMA near $67. After rejection, the price continues to drop within the bearish trend. The price is now testing support within the ascending channel at the $63 region, pointing to a possible move toward $60.
A break below the $60 level would likely trigger a sharper decline in oil prices. The overall trend stays bearish as long as the price trades under the 200-day SMA. In addition, the RSI remains below the mid-level, confirming continued downside momentum.
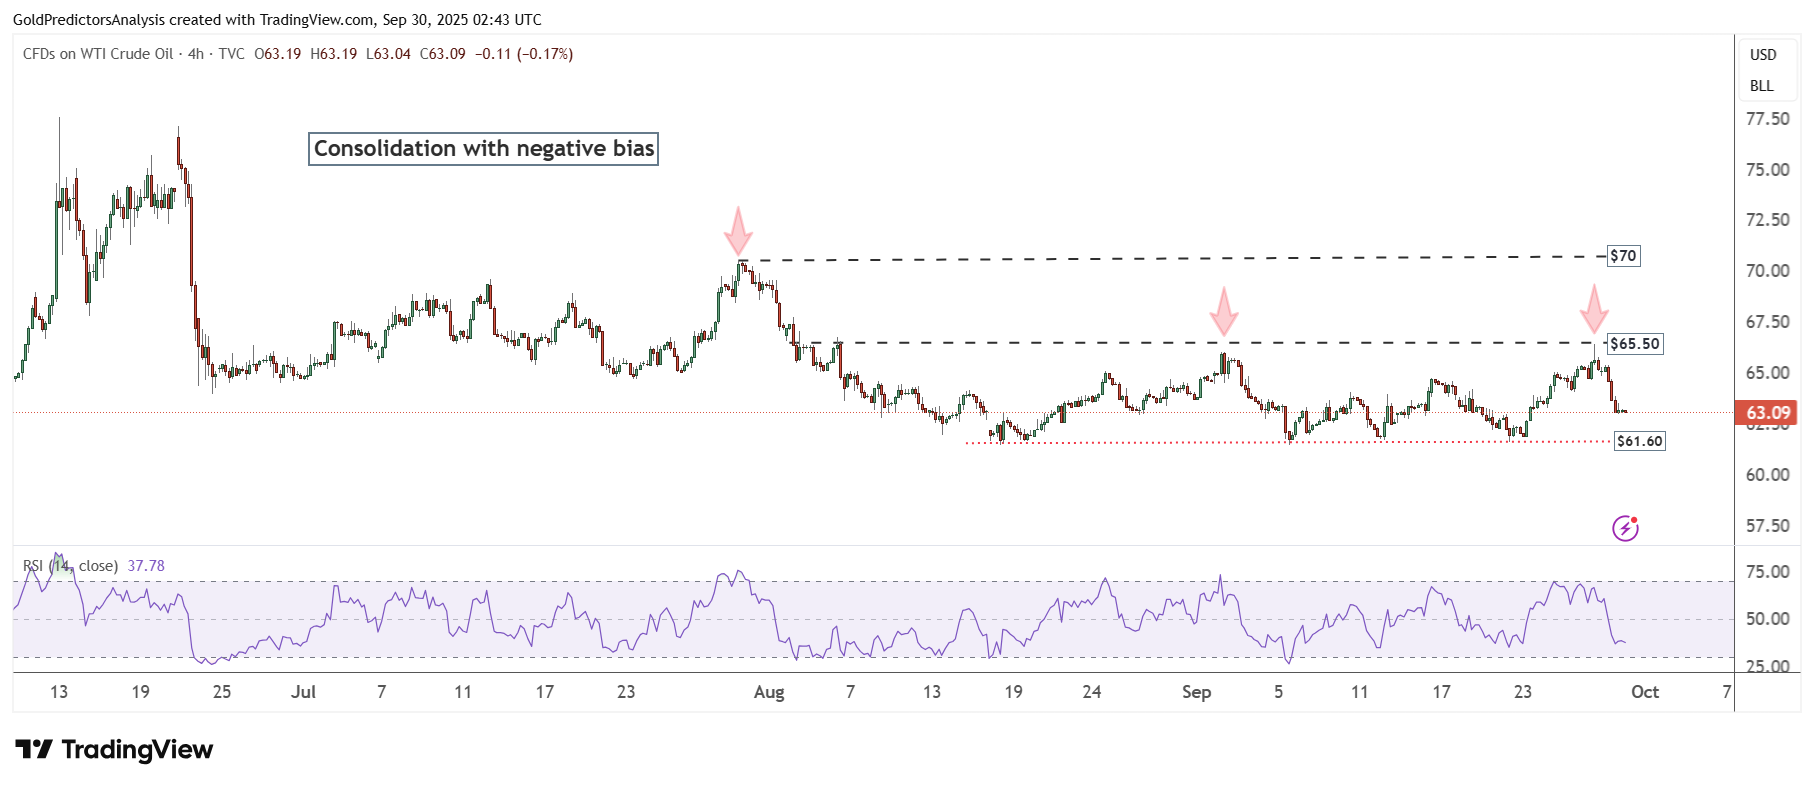
WTI Oil 4-Hour Chart – Consolidation with Negative Bias
The 4-hour chart for WTI crude oil shows that the price has been consolidating between the $60 and $65 region. This consolidation has created negative price action. A break below $60 would likely trigger a sharp decline in oil prices. As long as the price stays below the $70 level, the bearish trend is expected to continue.