 WTI crude oil (CL) extended its rebound for the second day, climbing above $64.50 per barrel. The recovery followed a two-week low hit on Monday. Strong inventory data and rising geopolitical risks injected fresh momentum into the market.
The chart below shows a draw of 0.6 million barrels in crude stocks. Refinery runs also held steady, signalling resilient demand despite mixed trade flows. This tighter supply outlook helped shift sentiment back to the upside.
Moreover, geopolitical tensions added further support to oil prices. Iran pledged to continue selling oil to China despite the risk of sanctions. At the same time, President Trump warned Europe to halt Russian energy imports or face tariffs. These developments fueled supply concerns and continued to exert upward pressure on oil prices.
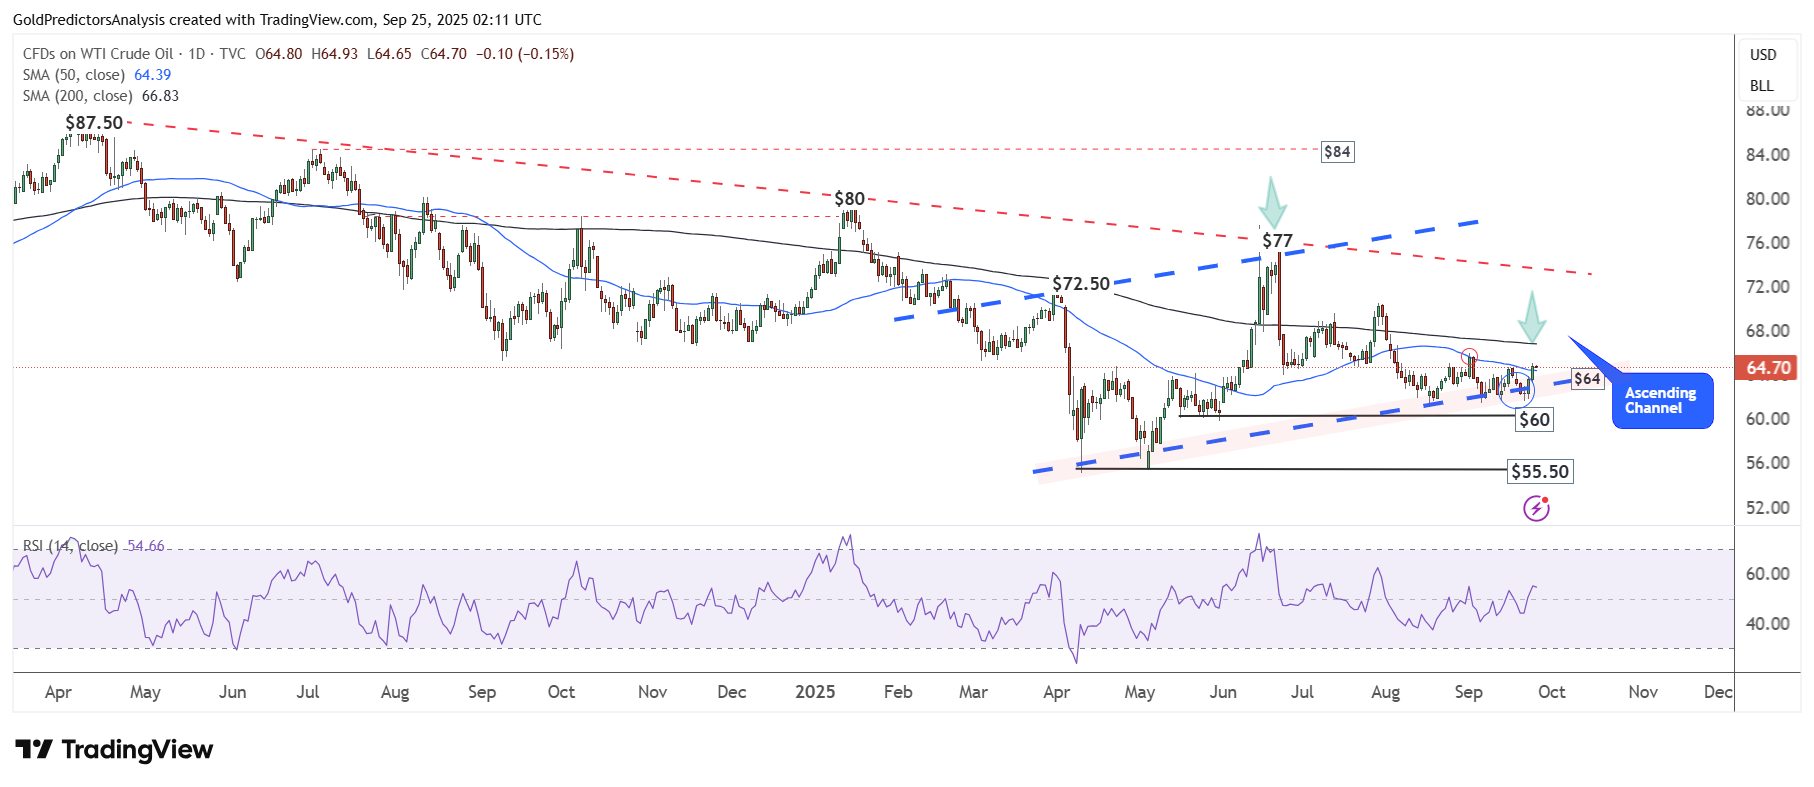
WTI Oil Daily Chart – Support Zone
The daily chart for WTI crude oil indicates that prices are rebounding from the support of the ascending channel, located near the $60 region. The immediate resistance remains at the 200-day SMA around $67. Oil is also attempting to close above the 50-day SMA, which signals that prices are in the process of rebounding toward the $67 level.
A break below $60 would trigger negative price action, while a break above $67 would open the door for further upside toward the $74 region. However, as long as prices remain below the red trendline near $74, the overall trend in oil continues to lean bearish.
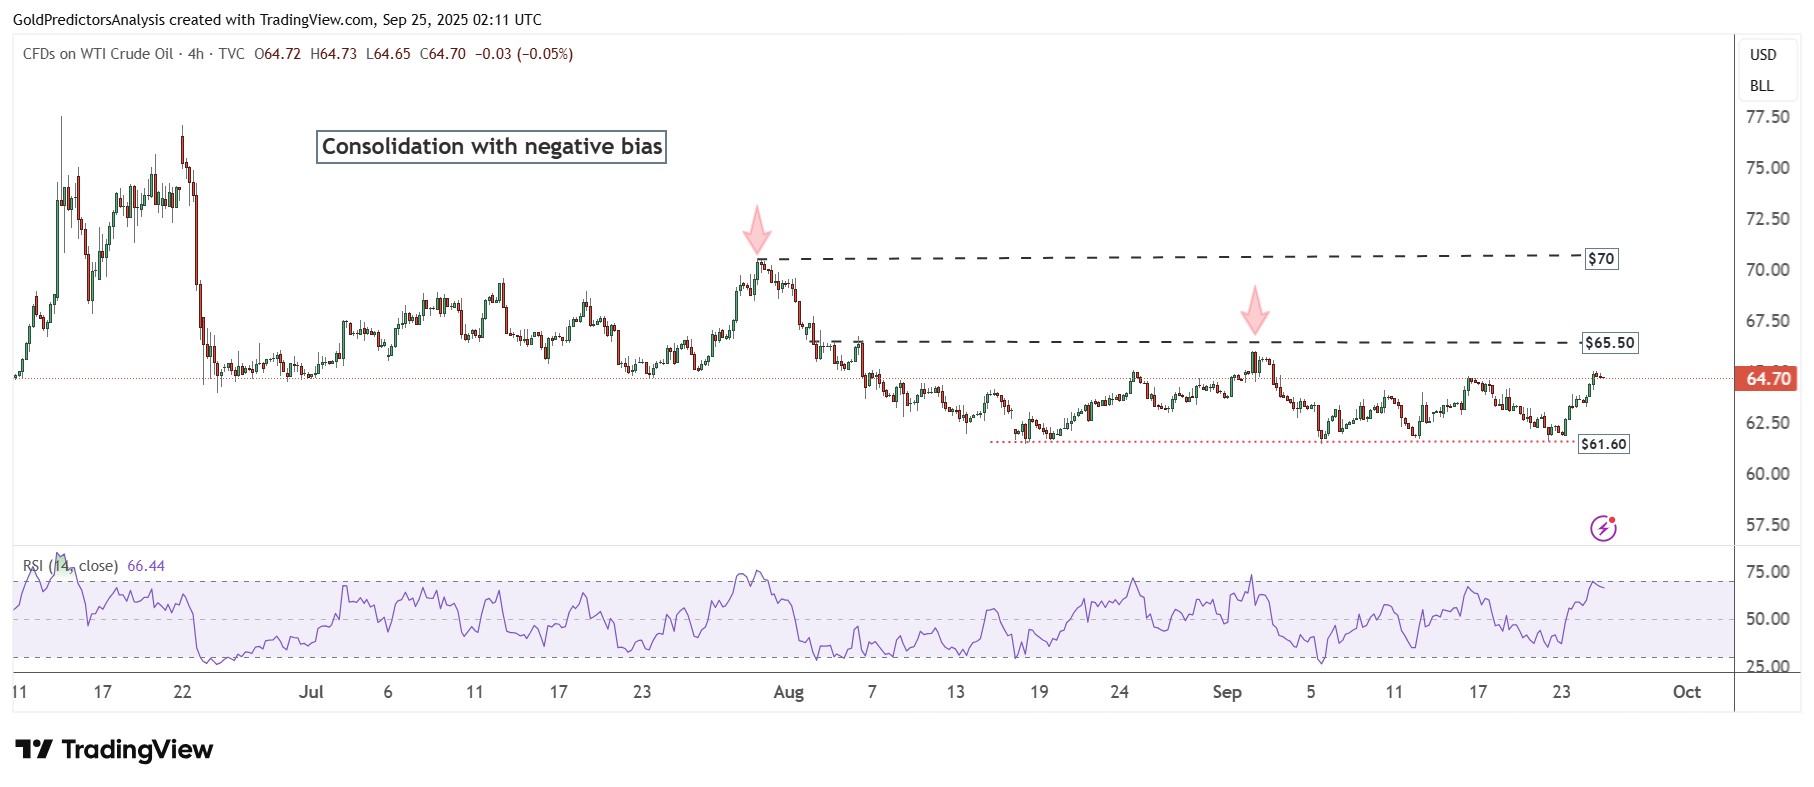
WTI Oil 4-Hour Chart – Consolidation
The 4-hour chart for WTI crude oil shows substantial consolidation between $61.60 and $65.50 over the past two months. Oil prices have repeatedly failed to break below the $60 level, with multiple attempts forming a solid support base.
A break above $65.50 would likely drive prices toward the $70 region, while a break below $60 would trigger negative price action and open the way for further downside.