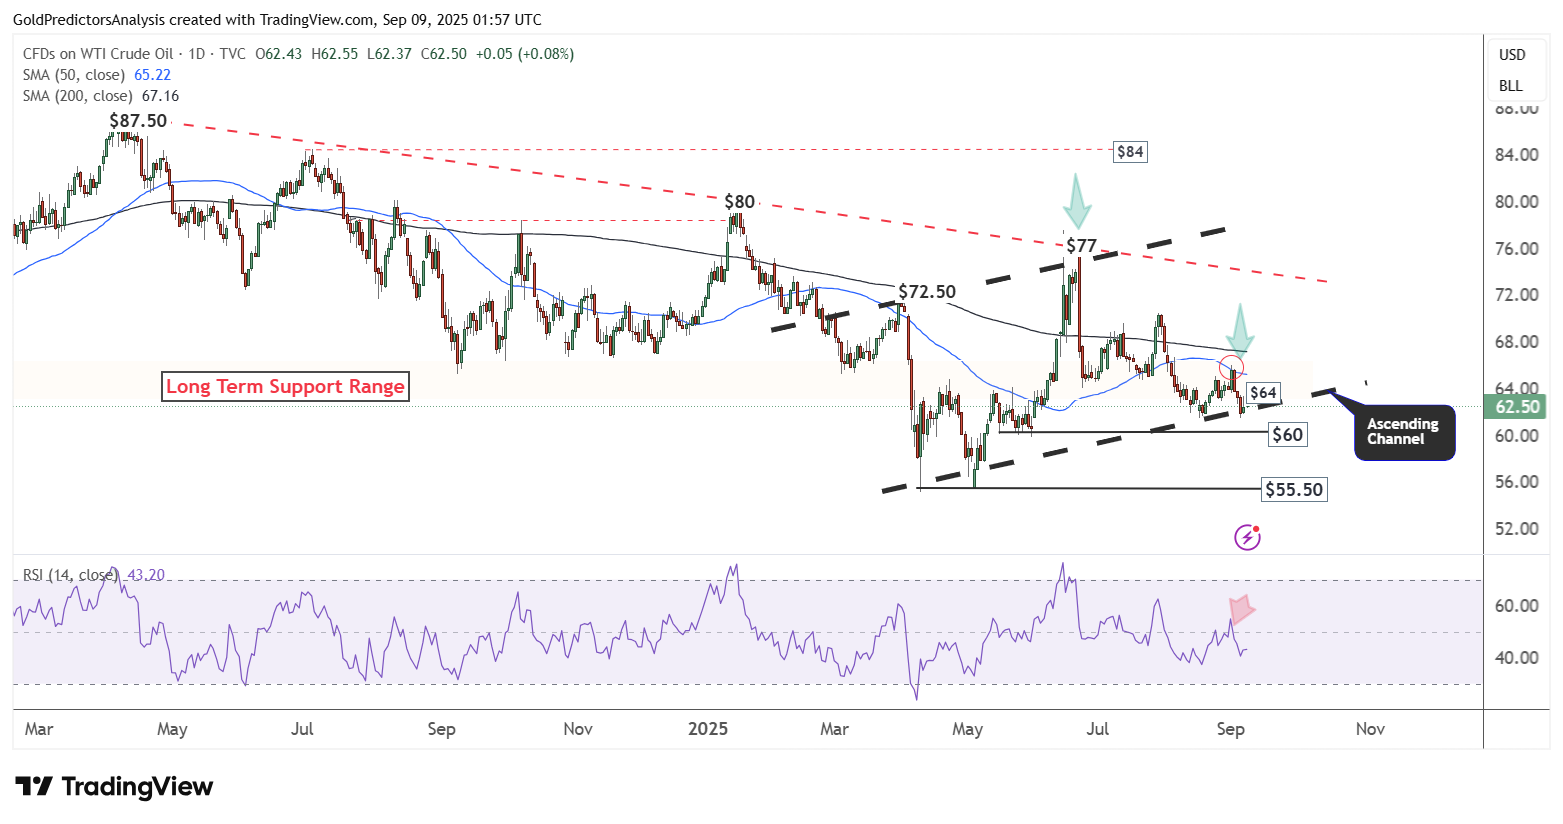
 The daily chart for WTI crude oil shows that the price has been consolidating near the edge of an ascending channel pattern. A break below $62 may find strong support around the $60 area. However, a drop below $60 could trigger a deeper correction toward $55.50.
The price is also consolidating below the 50-day and 200-day SMAs, indicating a bearish trend. As long as it remains below the red dotted trendline, prices are likely to decline in the coming months. A breakout above the $77 level is needed to invalidate the current bearish setup in the oil market.
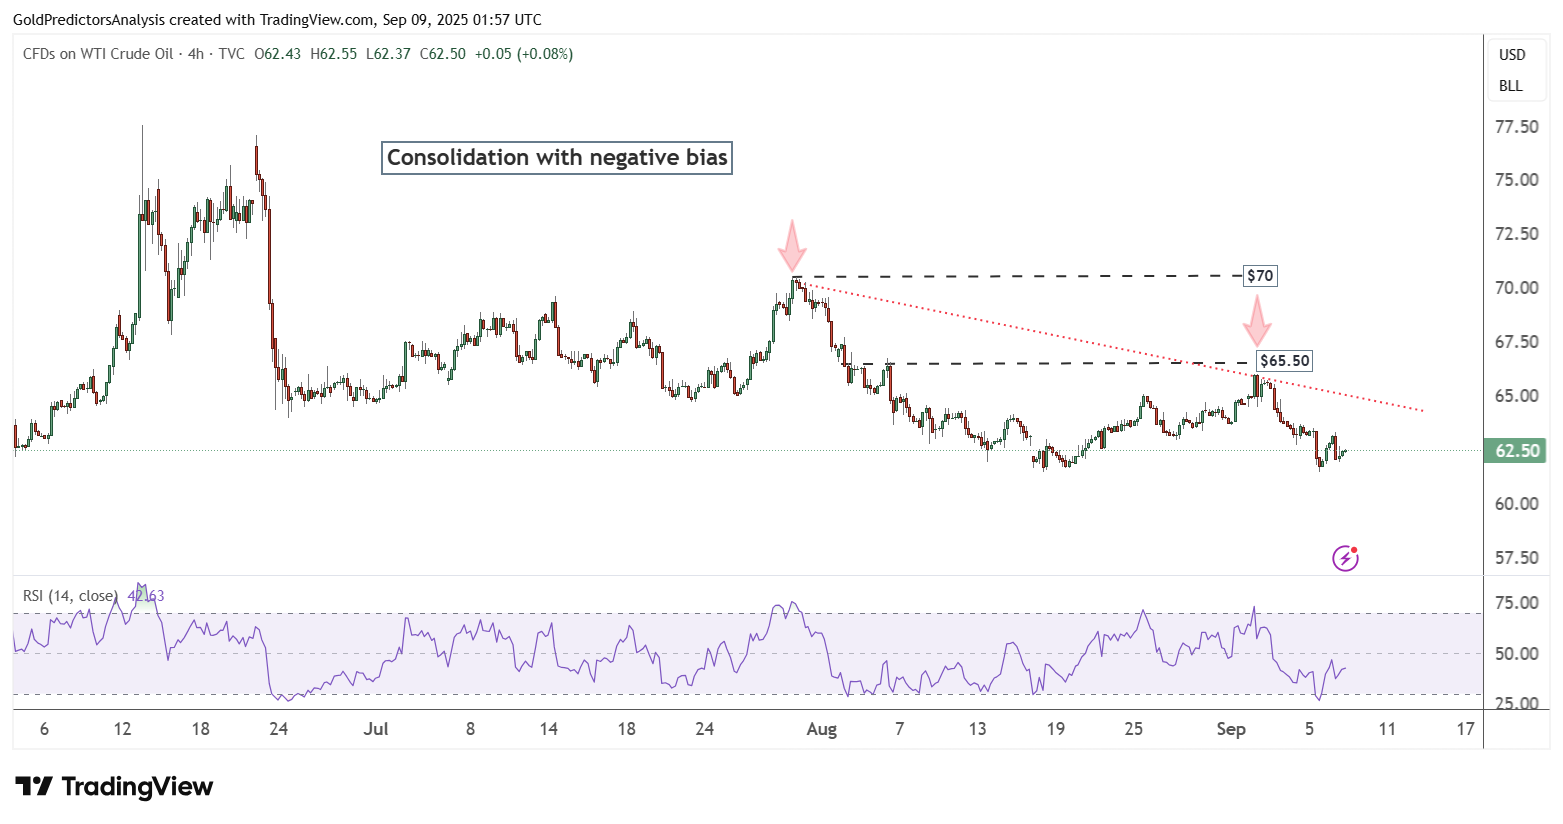
WTI Oil 4-Hour Chart – Negative Price Action
The 4-hour chart for WTI crude oil shows that the price has been trading below the $70 region and consolidating into a bearish pattern. The failure to break above $70 and $65.50 has kept oil prices within a downward trend, as shown by the red dotted trendline.
As long as the price remains below $65.50, further downside remains likely. However, the RSI indicates oversold conditions, suggesting a potential short-term rebound before another decline.