 WTI Oil Daily Chart – Consolidation
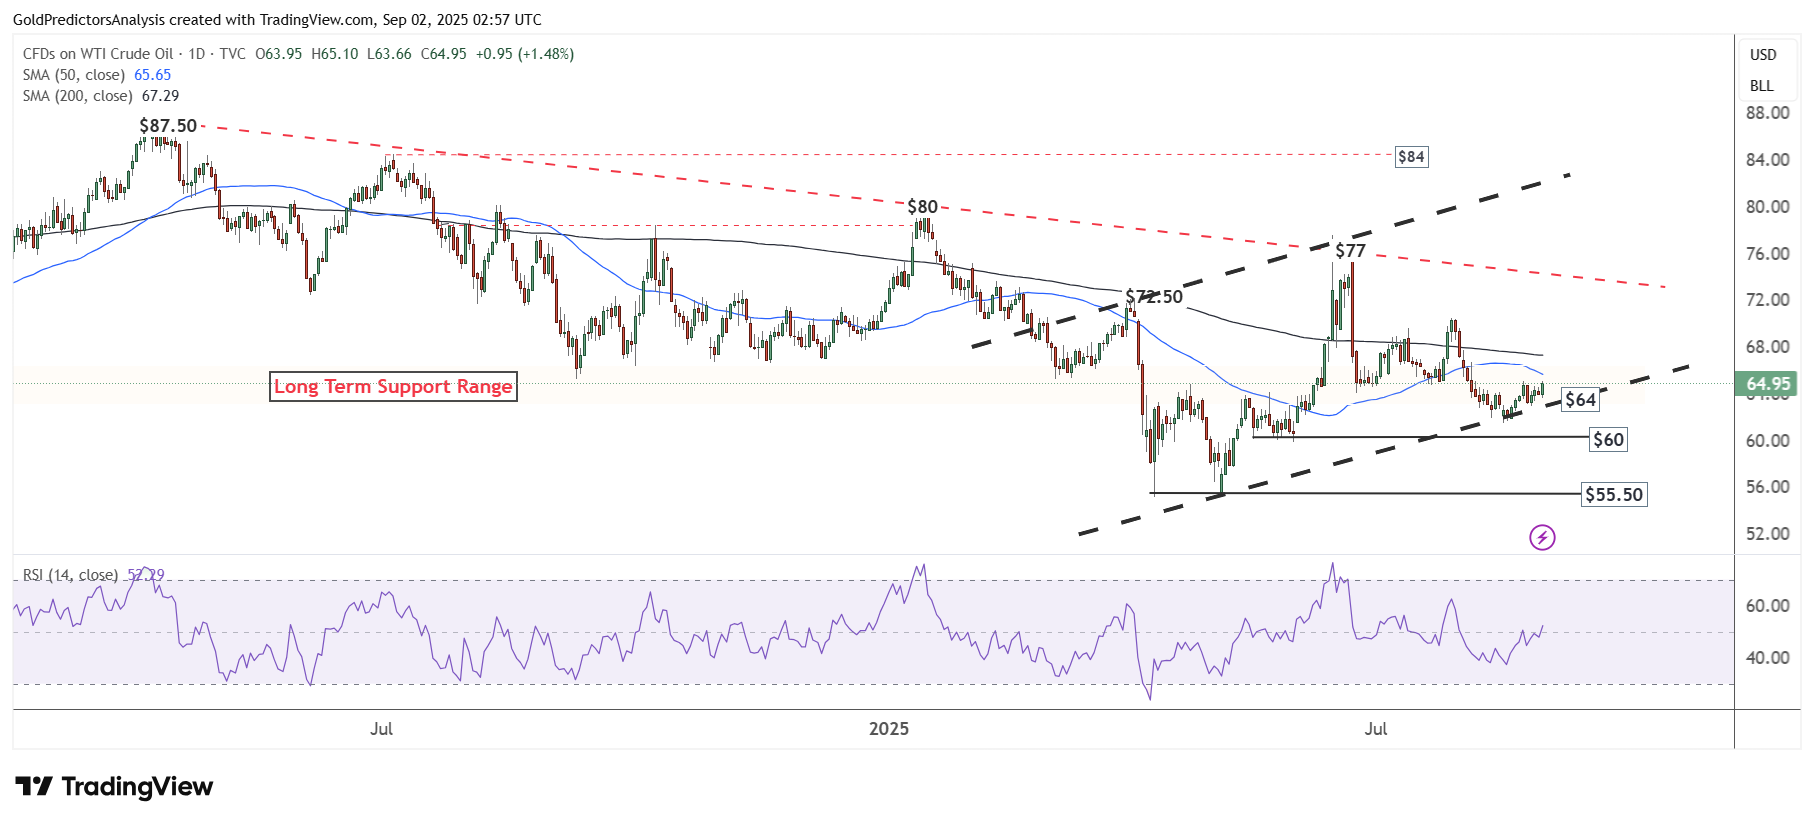
The daily chart for WTI crude oil indicates that the price is consolidating near the support of an ascending channel, located around the $64 region. This consolidation suggests that a rebound may be forming within the broader bearish trend.
The 50-day SMA remains below the 200-day SMA, indicating continued downside pressure. If WTI breaks above the 200-day SMA near the $67 level, it could trigger a rebound toward the red trendline around $74. A breakout above $74 would likely push prices further toward the $82–$84 region in 2025. However, if prices break below the $60 level, the next immediate support lies at $55.50. A move below $55.50 would signal a strong decline in oil prices.
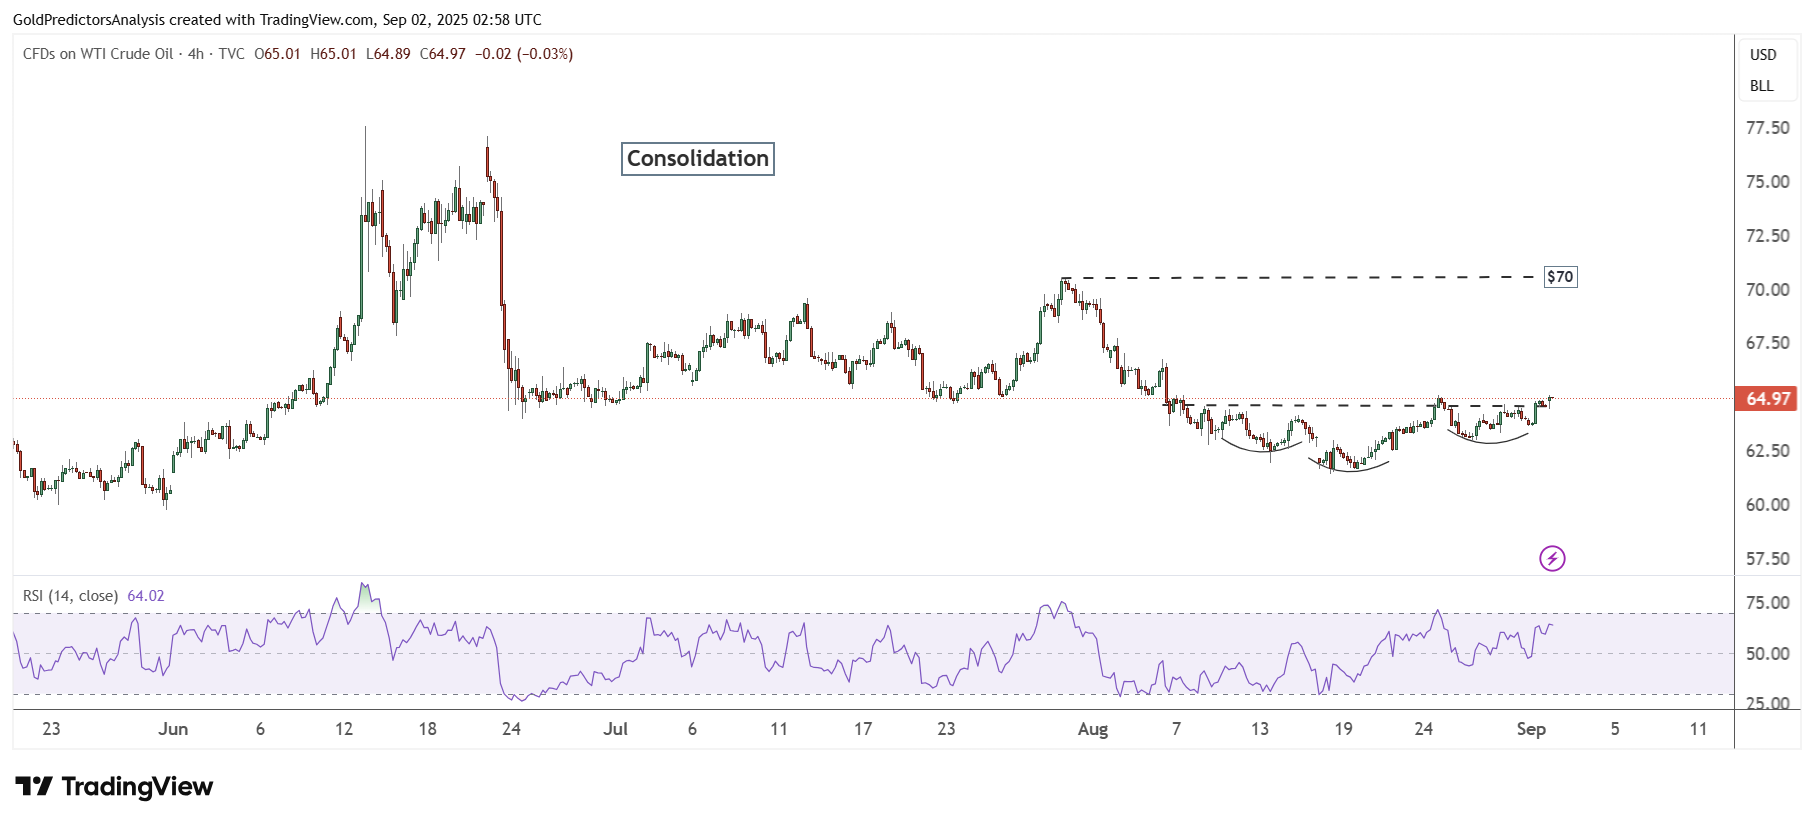
WTI Oil 4-Hour Chart – Consolidation
The 4-hour chart for WTI crude oil shows strong consolidation within a neutral zone. Prices have been trading between the $60 and $70 range with no clear direction. Currently, the price is consolidating around the $60 level and forming a short-term inverted head and shoulders pattern, which suggests a potential rebound toward the $67 area in the near term.