


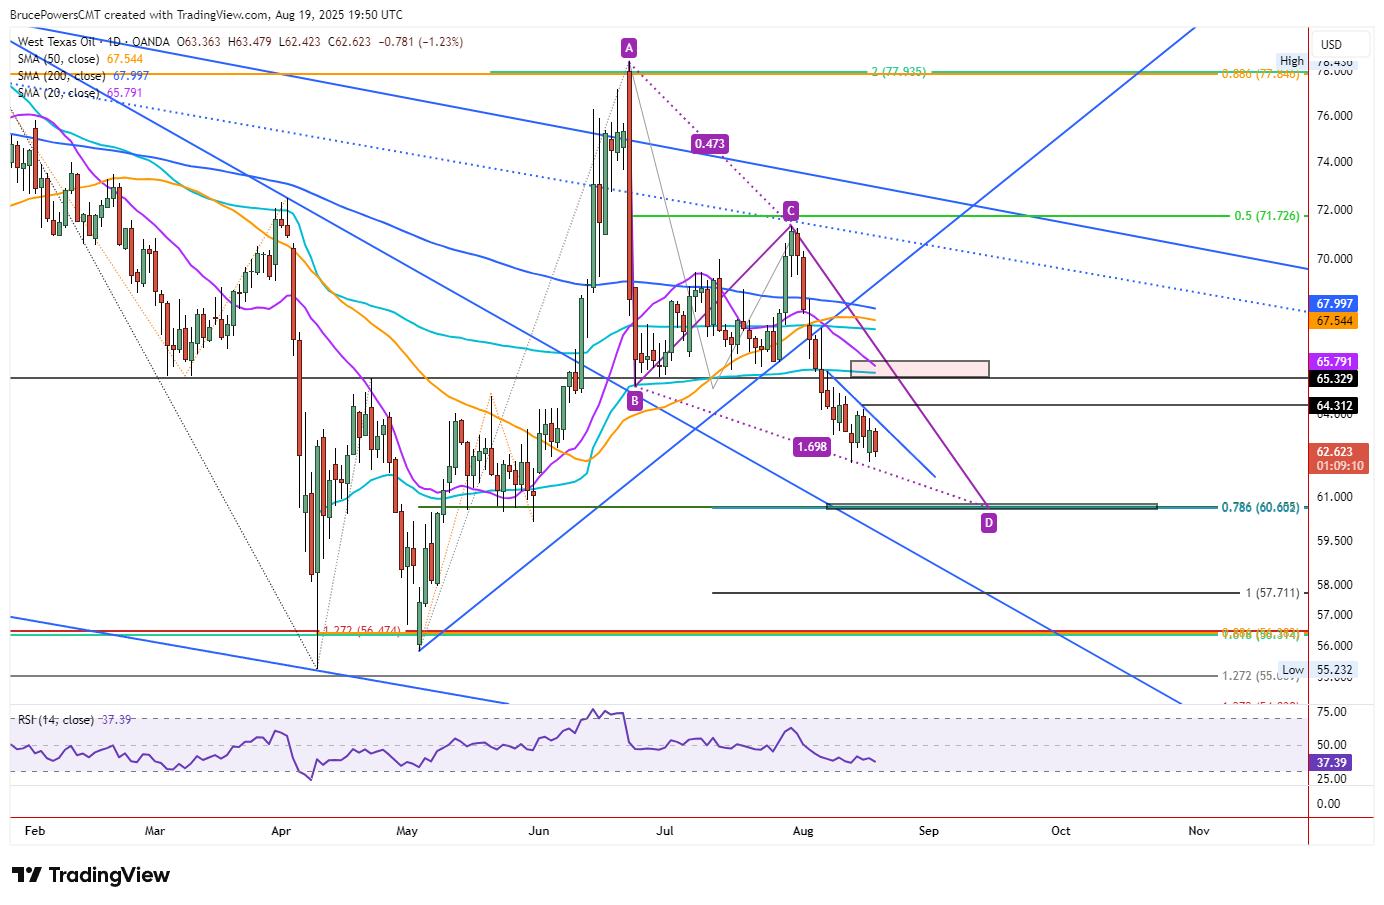
 Crude oil traded lower on Tuesday, consolidating within Monday’s price range and poised to close in the red. Downward pressure remains dominant as price action continues to unfold within a tight, declining consolidation.
Dynamic resistance is defined by a short downtrend line across the top of the pattern, which aligns with the 10-Day simple moving average, now at $63.65. At the time of writing, crude traded near the day’s low of $62.42, with the session high capped at $63.48.
Support and Downside Targets
The recent swing low of $62.19, recorded last Wednesday, marks critical near-term support. A decisive break below that level would confirm a continuation of the broader bearish trend. The next lower target is projected in a price zone between $60.66 and $60.60, which aligns with both a 78.6% Fibonacci retracement and a 78.6% measured target from a falling ABCD pattern. Beyond that, a 100% projection of the same ABCD structure points toward $57.71 as a deeper bearish objective.
Signs of Potential Reversal
Despite the weight of lower targets, the recent consolidation suggests bearish momentum has temporarily stalled. This opens the possibility of a short-term bullish reversal – just a possibility. A small double bottom pattern has developed within the formation, with a breakout signal triggered on a move above last Friday’s high of $64.18. If confirmed, this could pave the way for a test of resistance near the 20-Day moving average, currently at $65.78.


