


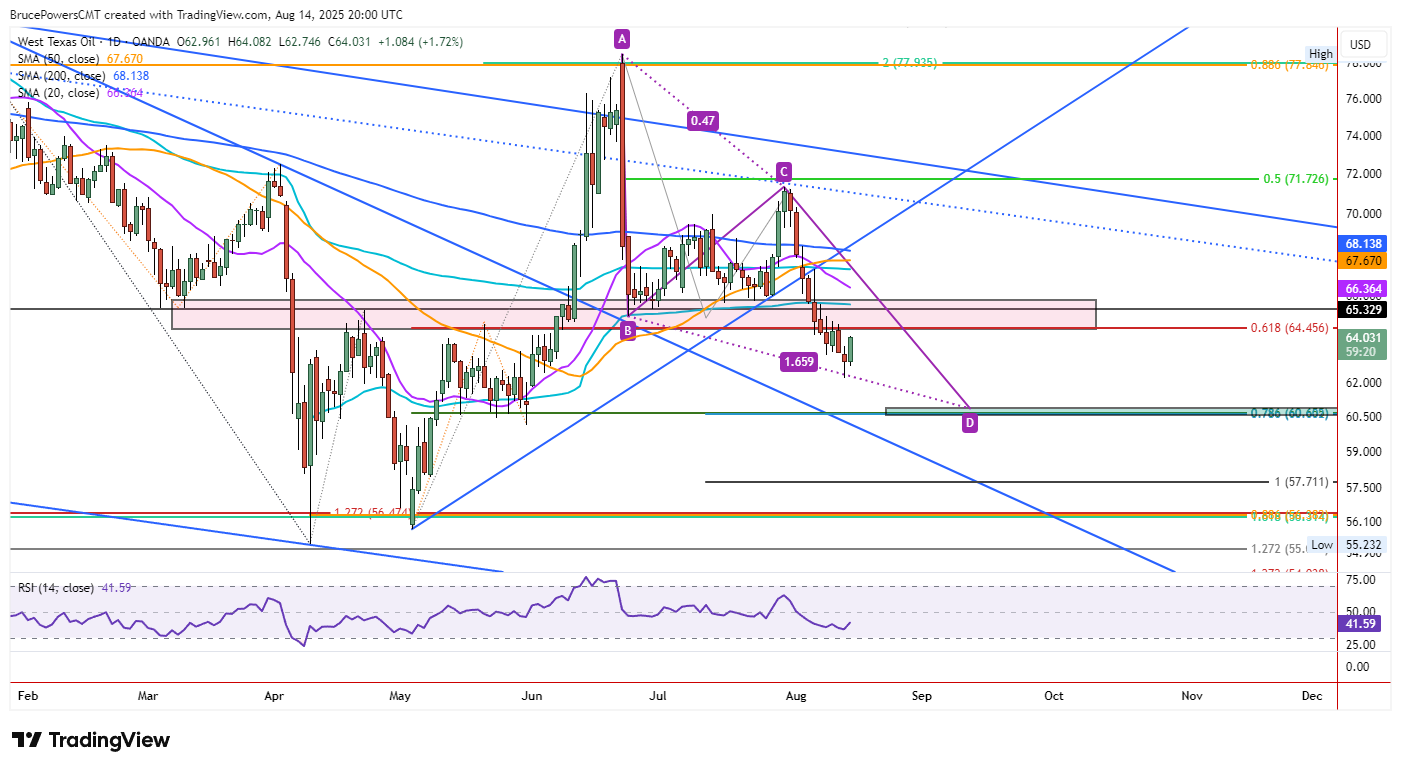
 Crude oil rallied strongly on Thursday after hitting a fresh bear trend low of $62.19 on Wednesday. The rebound pushed prices above Wednesday’s high of $63.63 and reached an intraday peak of $64.08, triggering a one-day bullish reversal pattern.
If prices secure a daily close above $63.63, that reversal will be confirmed, leaving oil positioned for further upside – even if only within the context of the broader downtrend.
Resistance from Prior Price Zones and Key Averages
The short-term path higher is challenged by a resistance band between $64.46 and $65.58, which includes a prior monthly low turned resistance at $65.46. Clearing $65.58 could bring the next wave of technical tests: the 20-Day moving average at $66.35, the 50-Day moving average at $67.67, and the 200-Day moving average sitting near $68.10. These levels are likely to attract selling pressure if the rally extends.
Downside Targets Defined by Fibonacci Confluence
On the downside, the next key support zone is clustered near $60.78–$60.66 — an area defined by a 78.6% ABCD pattern (purple) downside projection and a matching 78.6% Fibonacci retracement level. This target gains significance after a recent bearish crossover, where the 20-Day moving average fell below the 50-Day moving average, reinforcing the longer-term downtrend bias.


