


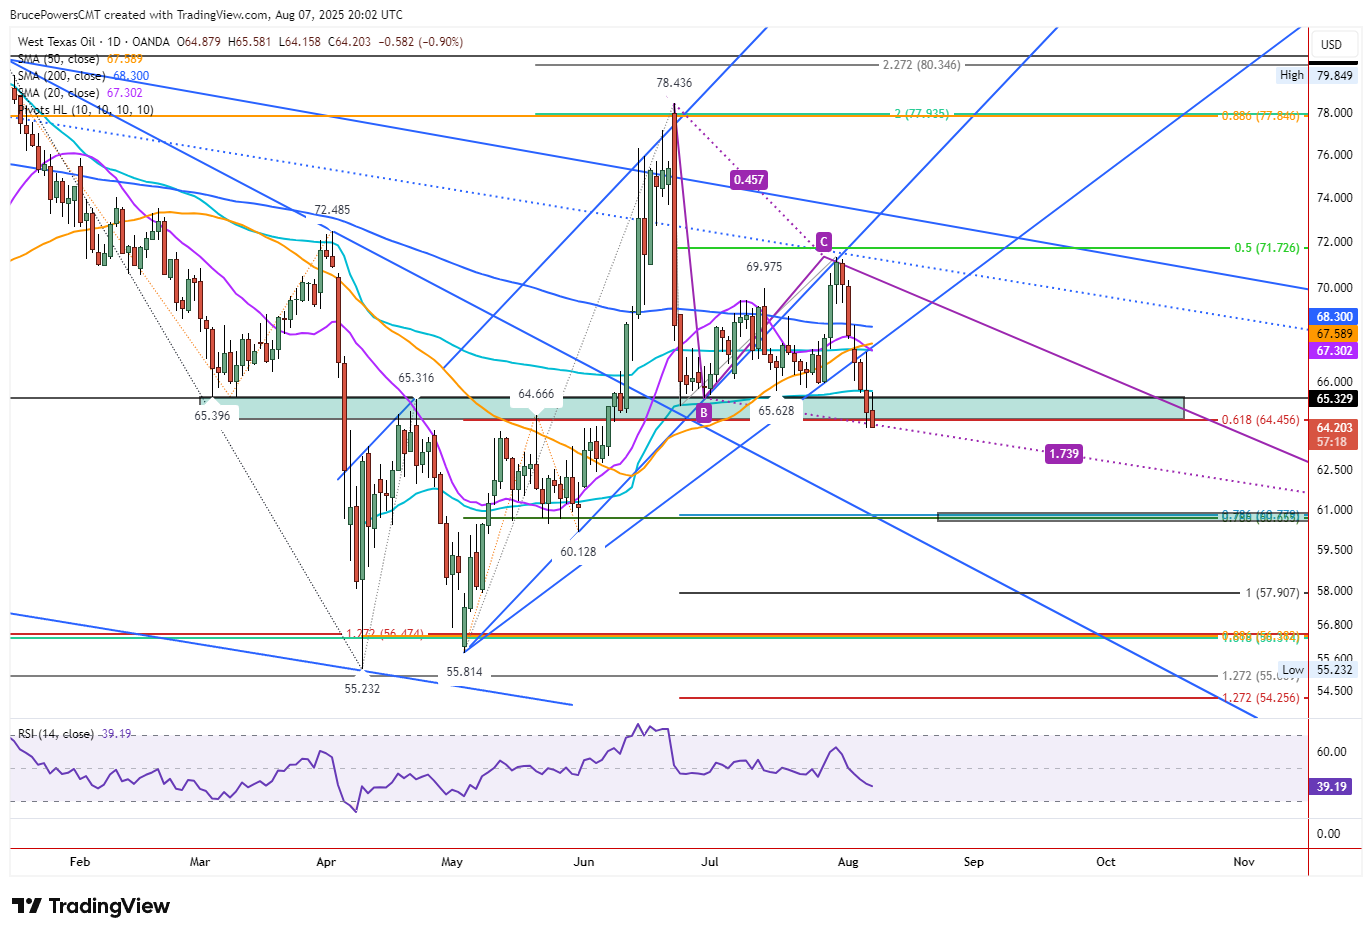
 Crude oil remains under sustained selling pressure following Wednesday’s decisive break below the 61.8% Fibonacci retracement level, a key support within the current corrective structure. As of Thursday, crude is trading near the low of the day at $64.16, placing it on track for what may become a nine-week daily closing low – an indication of growing downside momentum. A close near current levels would confirm a clear short-term trend shift and reinforce the bearish tone established earlier in the week.
Bearish Weekly Structure Signals Further Downside Risk
The 61.8% Fibonacci level at $64.46 had been acting as initial support in recent sessions, but the breakdown now confirms a failure of that level. It follows a prior violation of long-term support and further deteriorates the technical structure. With one trading day left in the week, crude oil is poised to complete a large weekly red bearish candle. A close near the week’s low would reflect persistent weakness and increase the likelihood of additional selling pressure into next week.
The significance of a strong bearish weekly close lies in the momentum shift it represents. Lower weekly closes after failed support typically indicate that buyers are stepping aside, allowing sellers to control the short-term direction.
Confluence Zone Near $60 Offers Next Key Support
Looking lower, the next potential support area sits around the confluence of two key levels: the 78.6% Fibonacci retracement at $60.66 and a 78.6% projection of a falling ABCD pattern at $60.78. Together, these levels form a structurally significant zone, where a pause or reaction could emerge. Until that zone is tested—or unless a bullish reversal takes shape before the – momentum remains aligned with the downside.


