 Oil prices dropped sharply as OPEC+ agreed to increase output by 547,000 barrels per day in September. This decision raised fresh concerns about global oversupply, especially after weak US gasoline demand data. Brent crude oil (BCO) settled at $68.76 and WTI crude oil (CL) at $66.19, both at their lowest levels in a week.
Traders reacted to US data showing record oil production and sluggish demand during peak driving season. These signs of weak consumption in the top oil-consuming nation added bearish pressure. The market now braces for the possibility that OPEC+ may unwind an additional 1.65 million barrels per day in their next meeting.
Moreover, geopolitical tensions added complexity. Trump threatened steep tariffs on Russian oil buyers, including India. While this risk limited the decline, uncertainty around potential US sanctions keeps the market on edge.
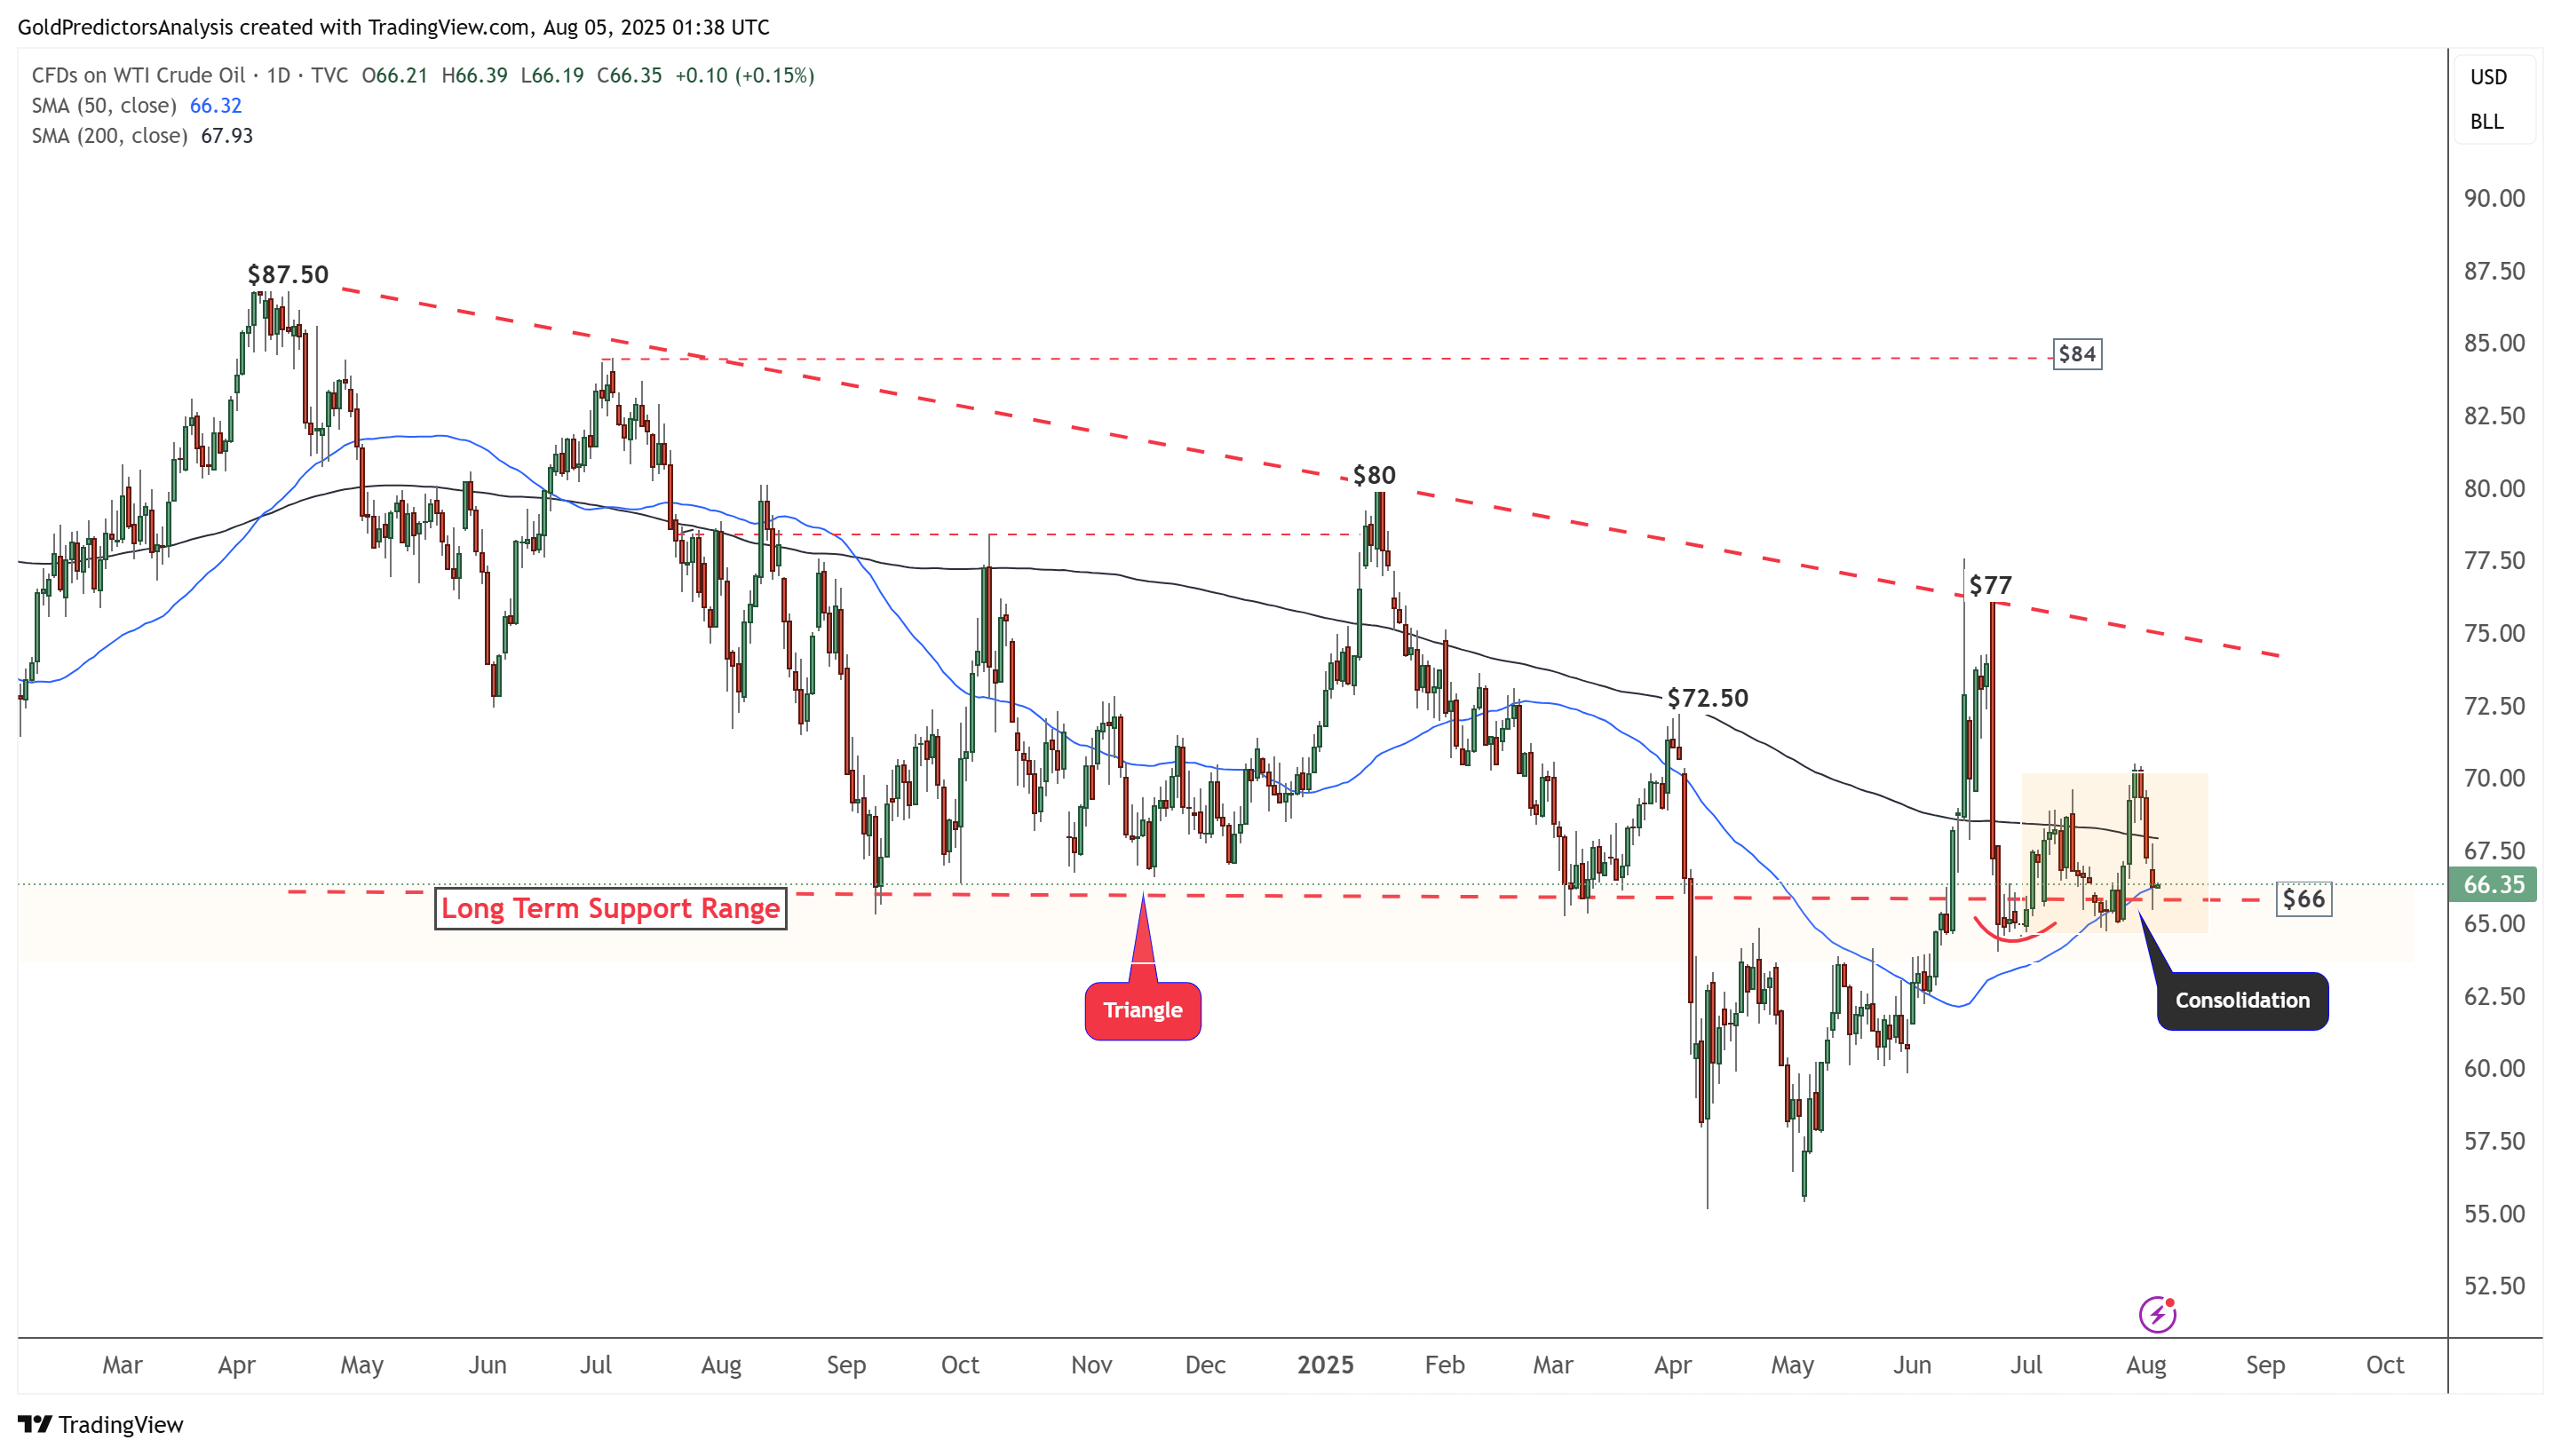
WTI Oil Daily Chart – Consolidation
The daily chart for WTI crude oil shows that the price has been consolidating within the long-term support range of the $64 to $66 area. These consolidations remain contained within a triangle pattern formed by the red dotted trendline. A break above $77 would signal a bullish breakout and could push oil prices toward the $84 region. However, a break below $64 would indicate further downside, with potential declines toward the $60 and $55 levels.
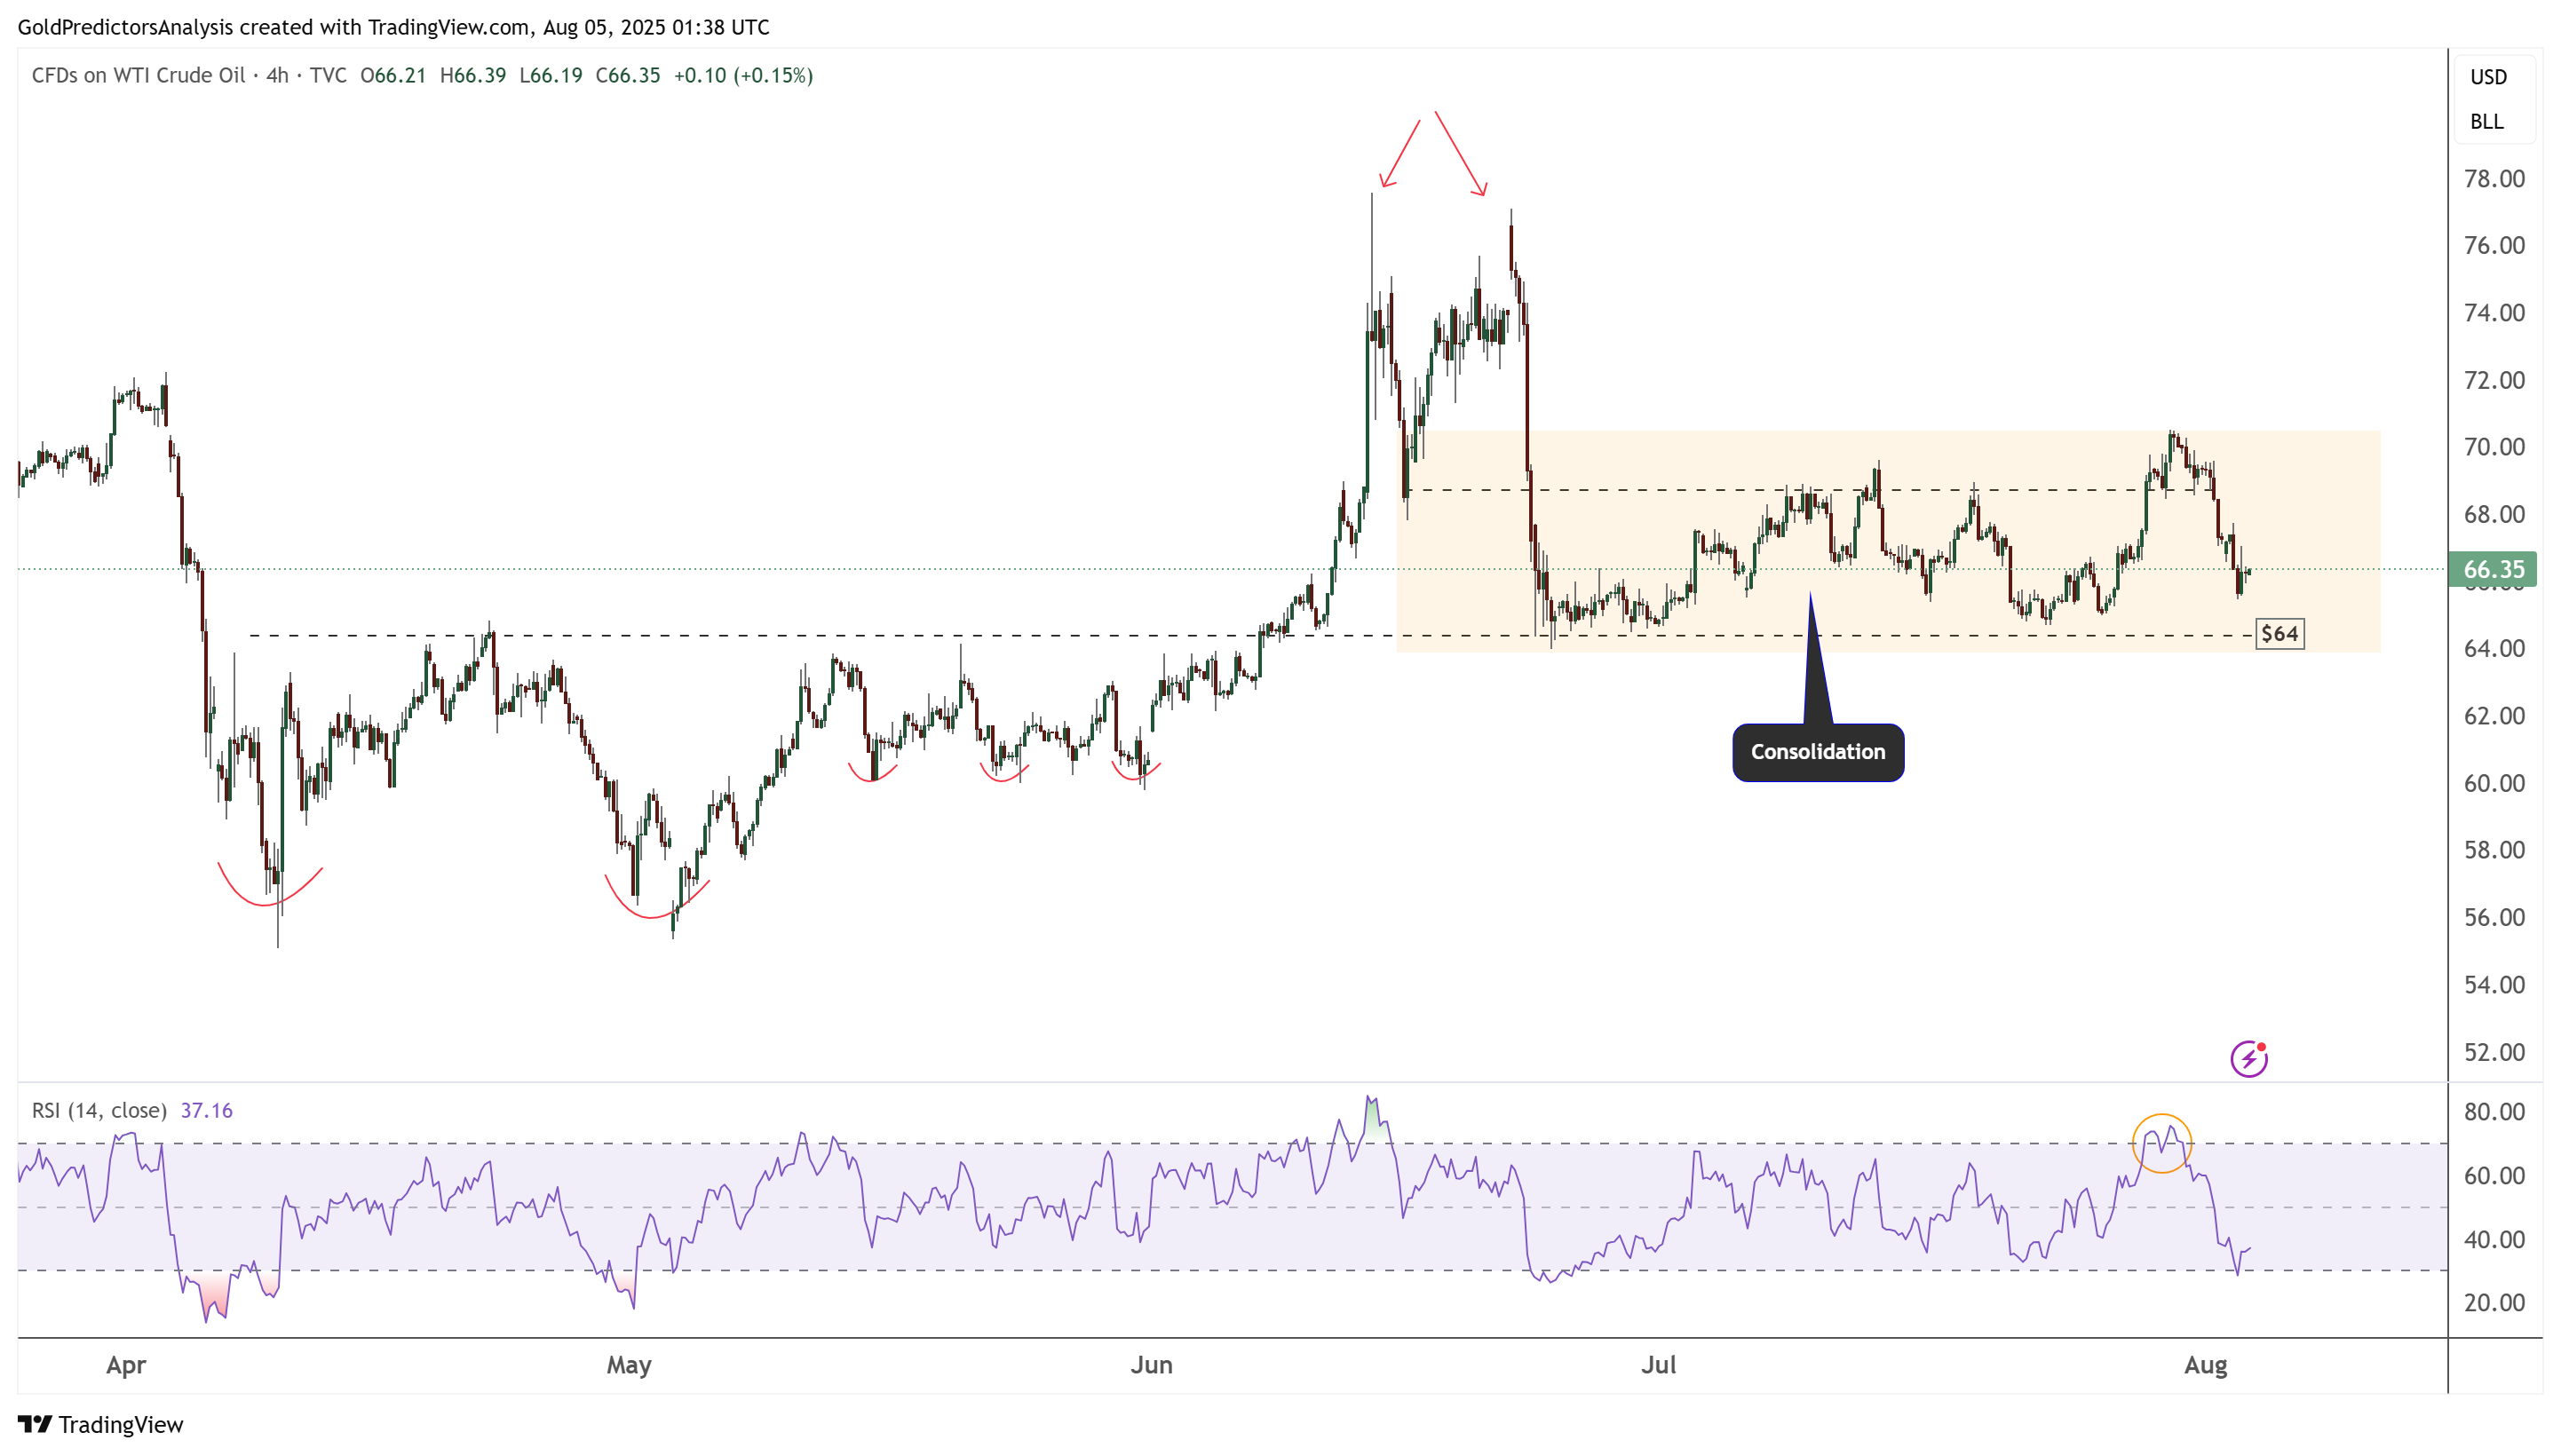
WTI Oil 4-Hour Chart – Consolidation
The 4-hour chart for WTI crude oil shows that the price has been consolidating within the $64 to $66 area, as highlighted by the orange zone. The formation of a double top suggests bearish price action, while a previous double bottom near the $55 area indicates a bullish setup. These opposing bullish and bearish patterns have caused the price to remain in a tight consolidation range. A breakout from either side of this range will likely determine the next directional move in oil prices.