


 Crude oil consolidated within the prior day’s range on Thursday and with a loss for the day. It again tested a resistance zone with the day’s high of $71.22. A lower rising trend channel line has been tested successfully as resistance for the past few days, and it follows a breakdown from the channel earlier in July.
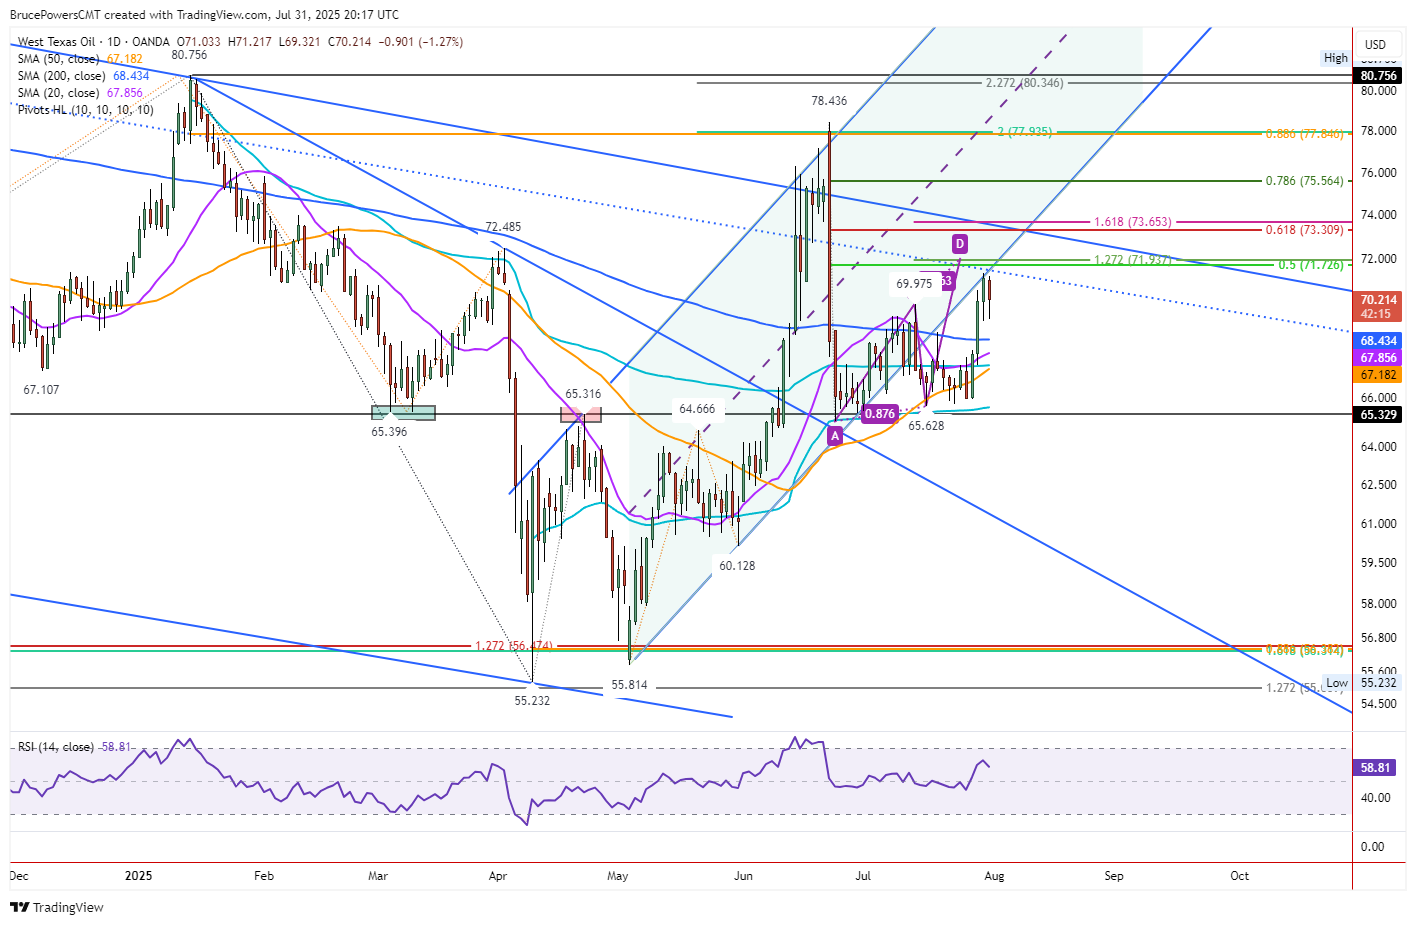
Given its current trajectory, crude oil might reach its next upside target around a 50% retracement level at $71.73, while continuing to test resistance around the trendline. The 50% zone is joined by a 127.2% projected target for a rising ABCD pattern at $71.94.
Five-Week High Breakout
Earlier in the week crude oil triggered a bull breakout to a five-week high of $71.33. It is on track to end the week in a relatively bullish position, in the upper third of the week’s trading range. If it can close the week above $69.98, the bullish breakout on the weekly timeframe will be confirmed. That would potentially increase the possibility of a continuation to the upside, at least to the next target zone mentioned above.
If the advance can continue, as the weekly chart supports, the 61.8% Fibonacci retracement zone at $73.31 is the next upside target. A downtrend line crosses through that Fibonacci level by August 11. After that a downtrend line will represent potential dynamic resistance prior to the 61.8% level.
Support at 200-Day Moving Average
Given that there have been signs of short-term resistance over the past couple of days, a pullback might follow. Potential support around the 200-Day MA is a key area to watch for a bounce and bullish reversal. However, if selling persists there is a consolidation zone of potential support down to the recent low at $65.63. That should slow down bearish momentum if it persists. This week’s low of $65.90 is also a potential support area of note, as well as last week’s high of $67.68.


