 Oil prices dropped on Tuesday as concerns about a potential US–EU trade war weighed on market sentiment. Investors worry that rising tensions between the two major crude consumers will dampen economic activity and curb fuel demand growth. Brent crude oil (BCO) dropped to $67.95, while WTI crude oil (CL) dropped to $65.50.
The expiration of the August WTI contract added to short-term selling pressure. Since the June 24 ceasefire between Israel and Iran, oil markets have lacked clear direction. Fading supply concerns from the Middle East and rising output from producers have limited price gains. Brent and WTI oil have traded within tight ranges over the past few weeks.
Trade tensions have become the dominant factor, outweighing support from a weaker US dollar. A softer dollar typically boosts crude prices by making oil more affordable for non-dollar buyers. However, the threat of a 30% US tariff on EU imports by August 1 has increased fears of a broader slowdown. The EU is now preparing counter-measures, adding to uncertainty.
WTI Crude Oil (CL) Technical Analysis
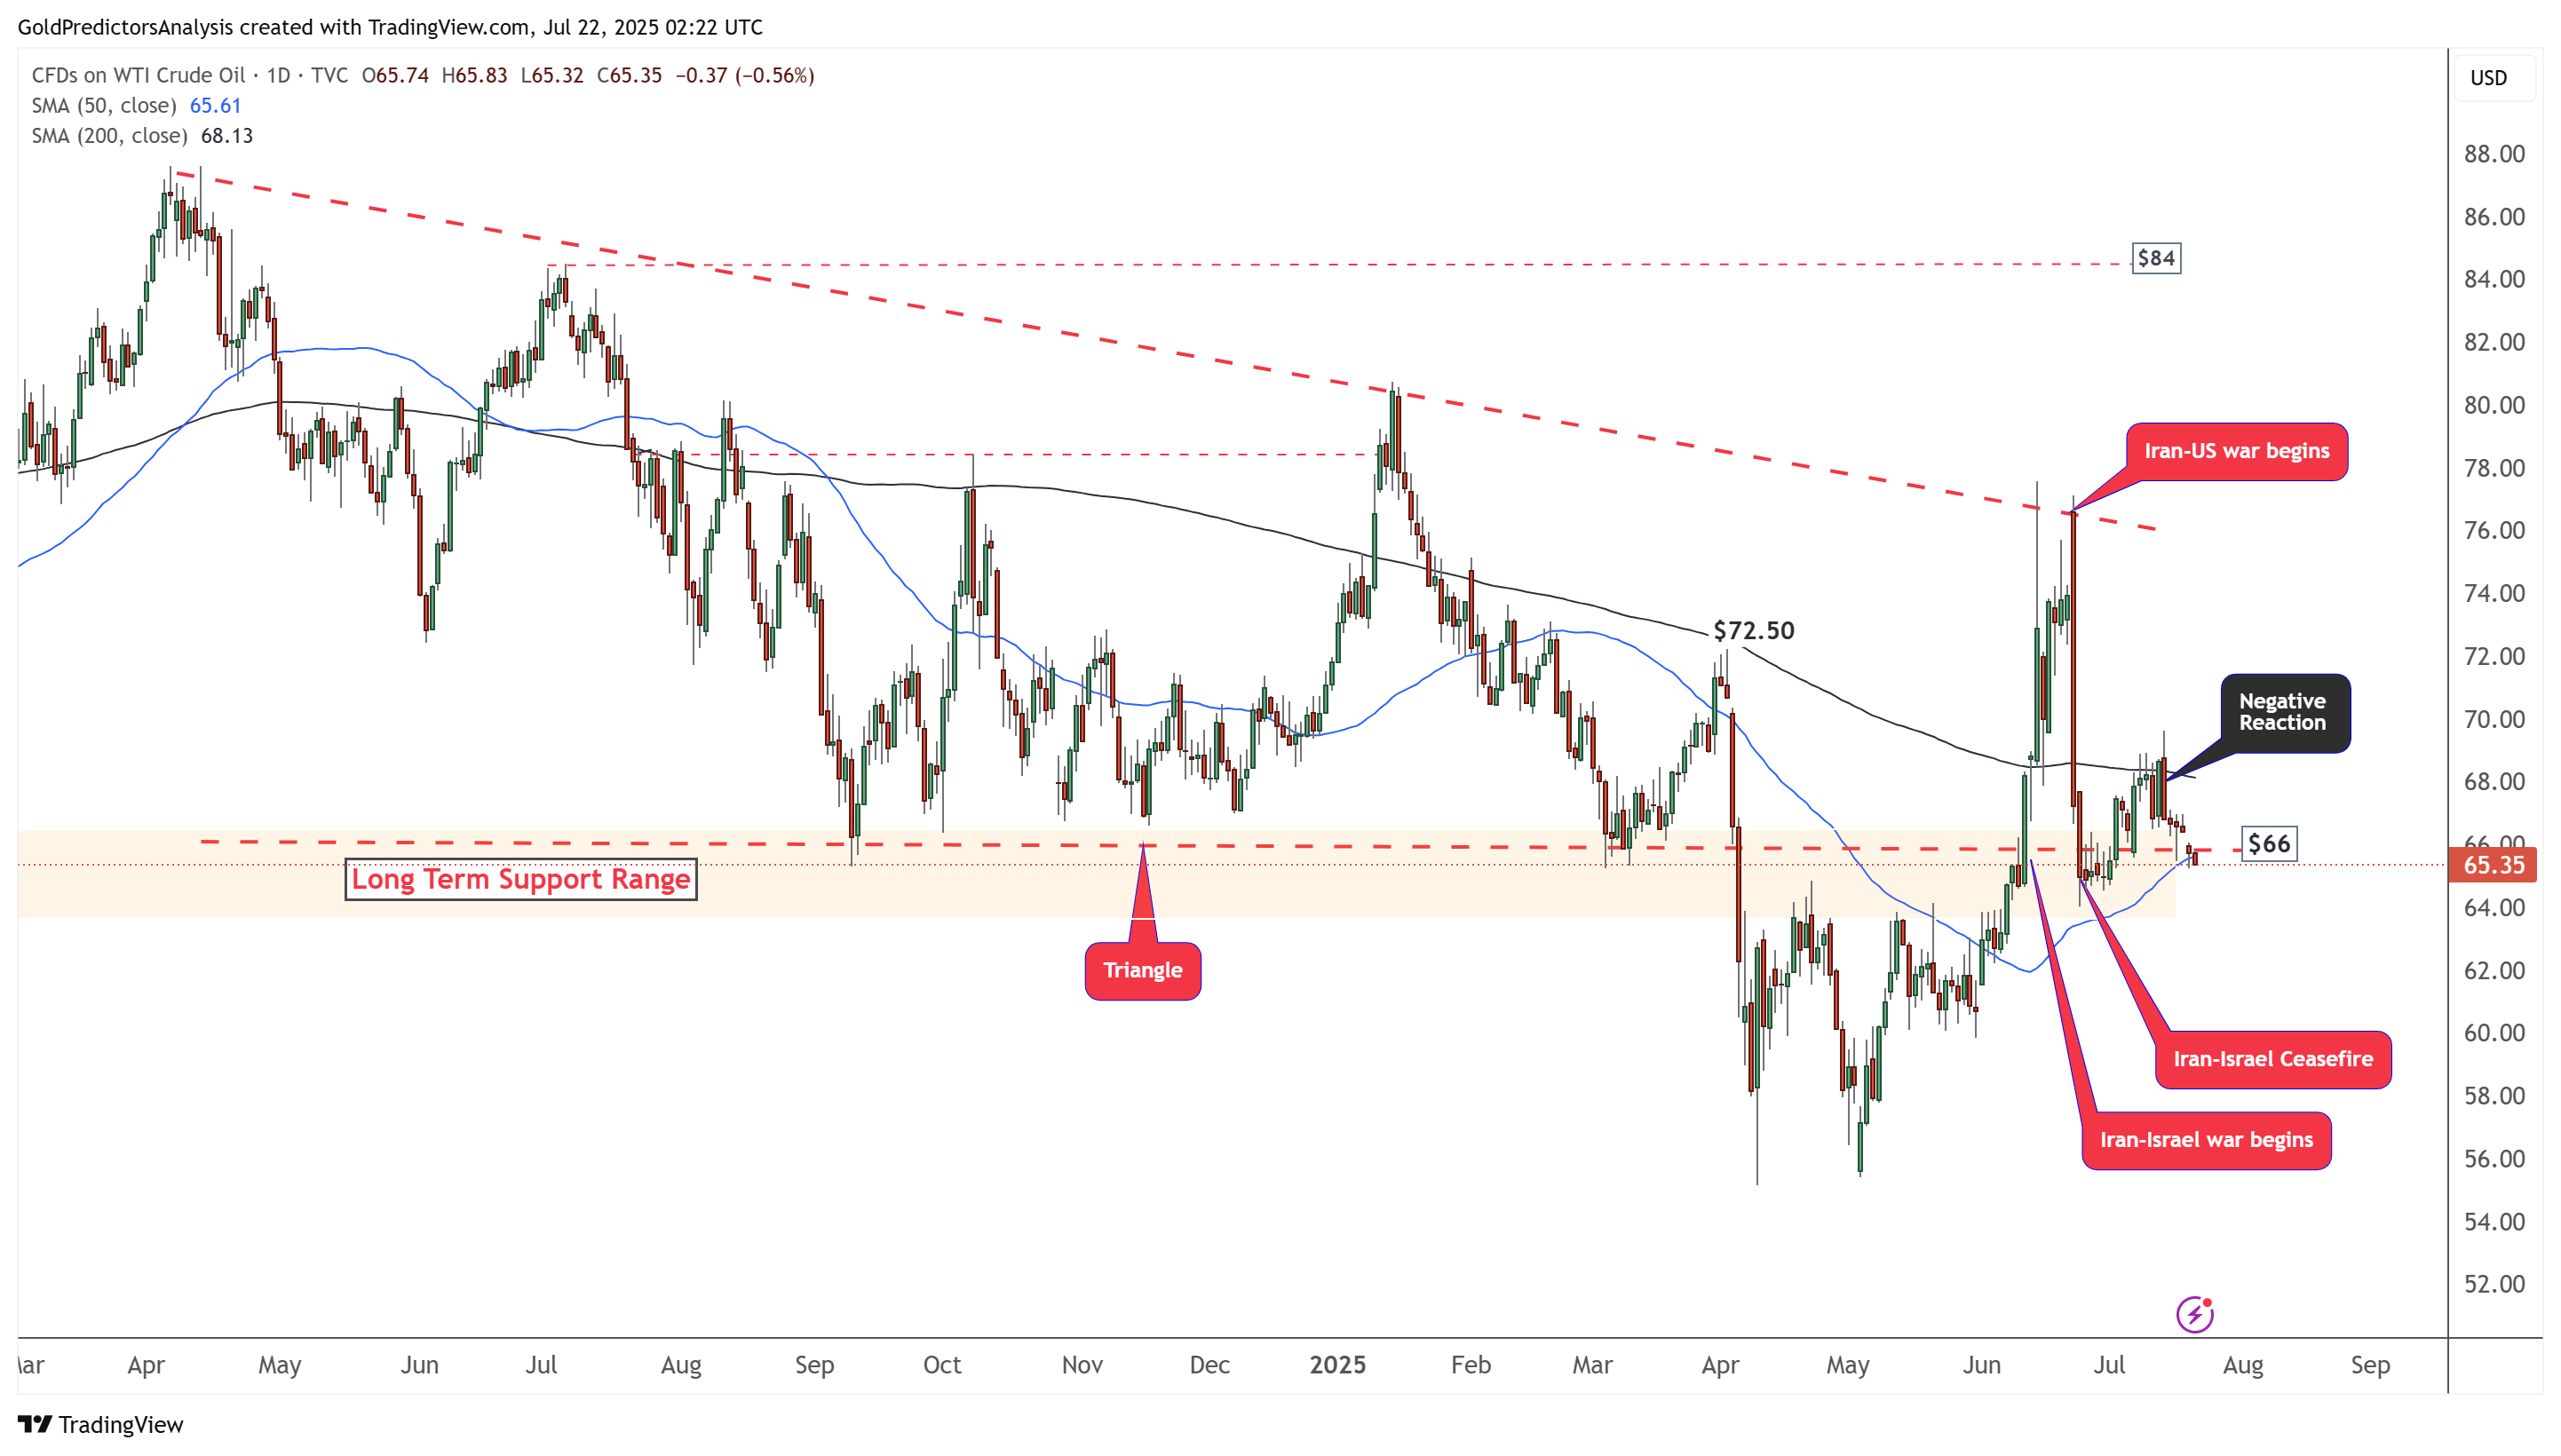
The daily chart for WTI crude oil shows that the price is retreating from resistance near the 200-day SMA at the $69 level. It is now testing the 50-day SMA, and a break below the $64 area would signal further downside. The sharp moves in oil prices reflect heightened global volatility driven by escalating tensions in the Middle East, particularly the conflict between Israel and Iran.
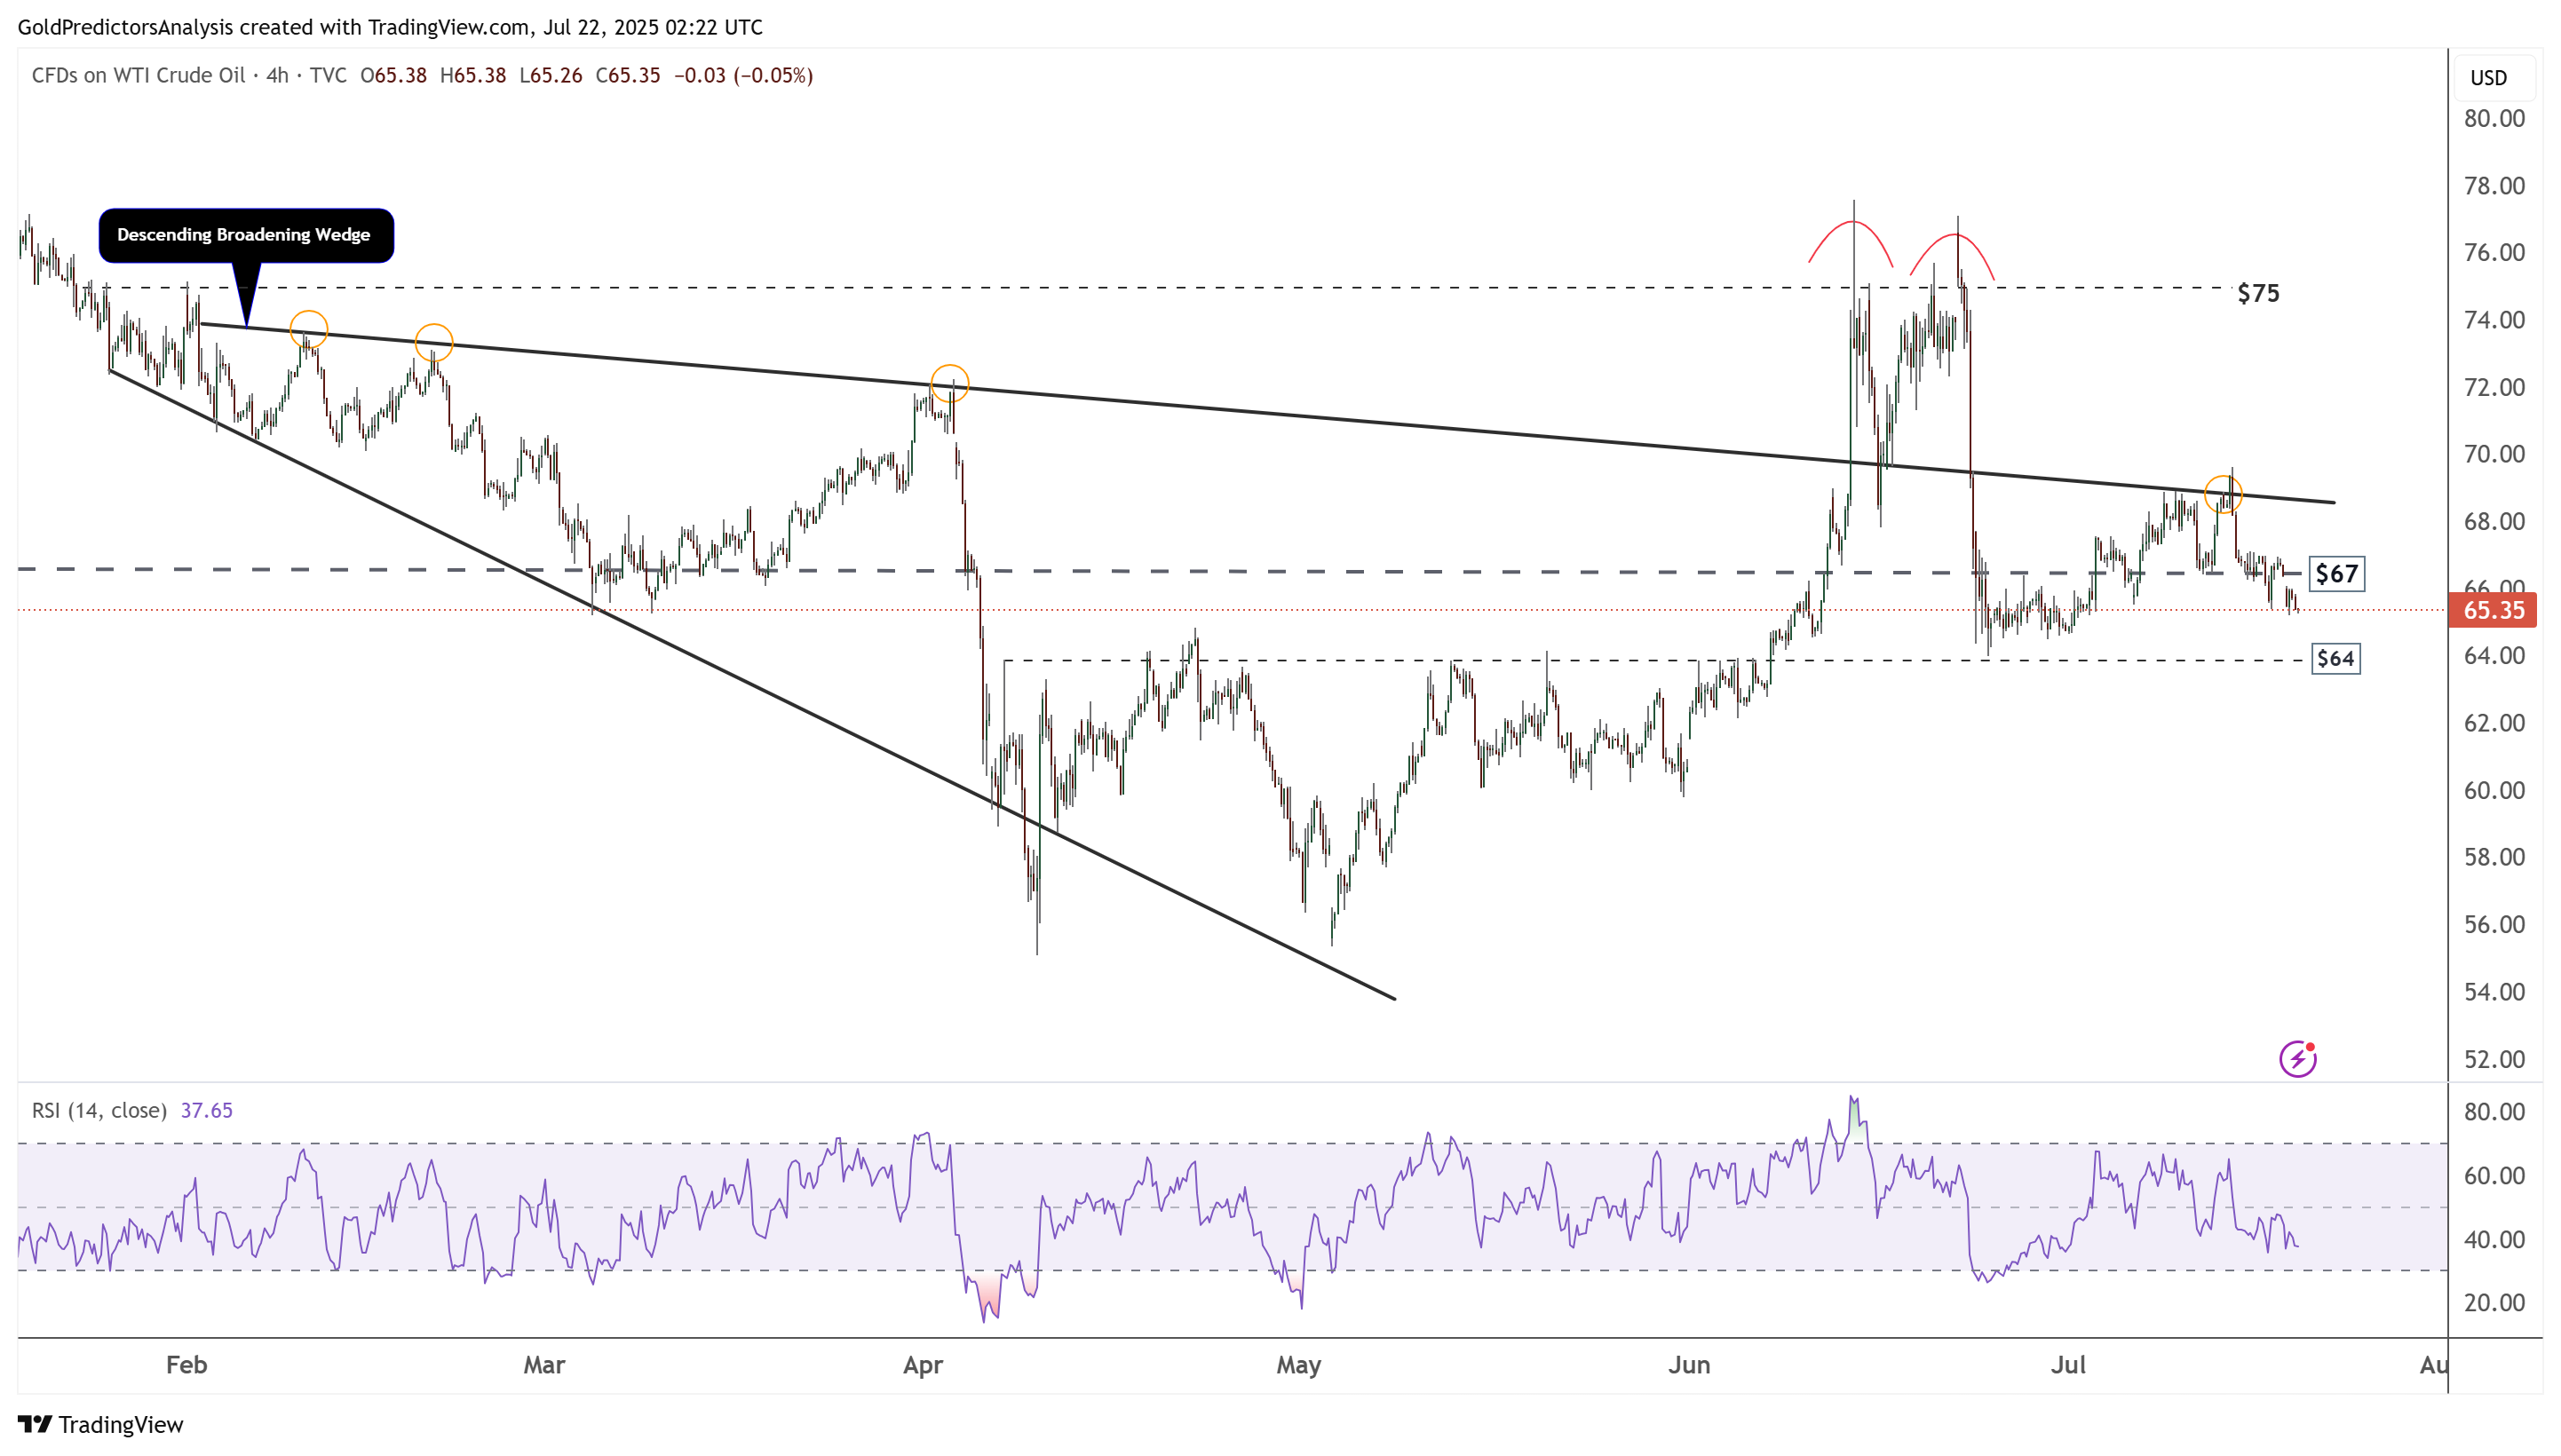
WTI Oil 4-Hour Chart – Double Top Formation
The 4-hour chart for WTI crude oil shows that the price is consolidating within a descending broadening wedge pattern. A previous breakout from this pattern failed near the $77 resistance level, forming a double top before the price fell back into the wedge. The price is now retreating from the $69 resistance area and appears to be heading toward the $64 level. A break below $64 would likely trigger further downside.