 Oil prices rebounded from the long-term support at $66 as the market absorbed mixed signals. Strong US gasoline demand supported prices, with consumption rising 6% to 9.2 million barrels per day. However, crude inventories surged by 7.1 million barrels, defying expectations of a draw. This unexpected surge in production reflects ongoing production strength, but high gasoline usage signals healthy economic activity and robust travel demand.
Moreover, the tensions in the Red Sea added a layer of geopolitical risk. Recent Houthi attacks on commercial vessels renewed concerns over shipping disruptions. These incidents raise concerns about supply chain disruptions, particularly for oil transportation, which typically drives prices higher. The situation remains volatile and could escalate rapidly if further attacks occur.
The US Energy Information Administration forecasted lower oil output in 2025. Declining prices have led American producers to scale back drilling. This reduction in future supply adds upward pressure on prices. Meanwhile, Trump’s announcement of a 50% tariff on copper could affect broader commodity sentiment, increasing uncertainty in energy markets.
On the other hand, OPEC+ plans to boost supply by 548,000 barrels per day in August. UAE officials emphasised that markets are absorbing extra barrels without building large inventories. This indicates that global demand may be stronger. If inventory levels remain low, oil prices could stay elevated despite increasing supply.
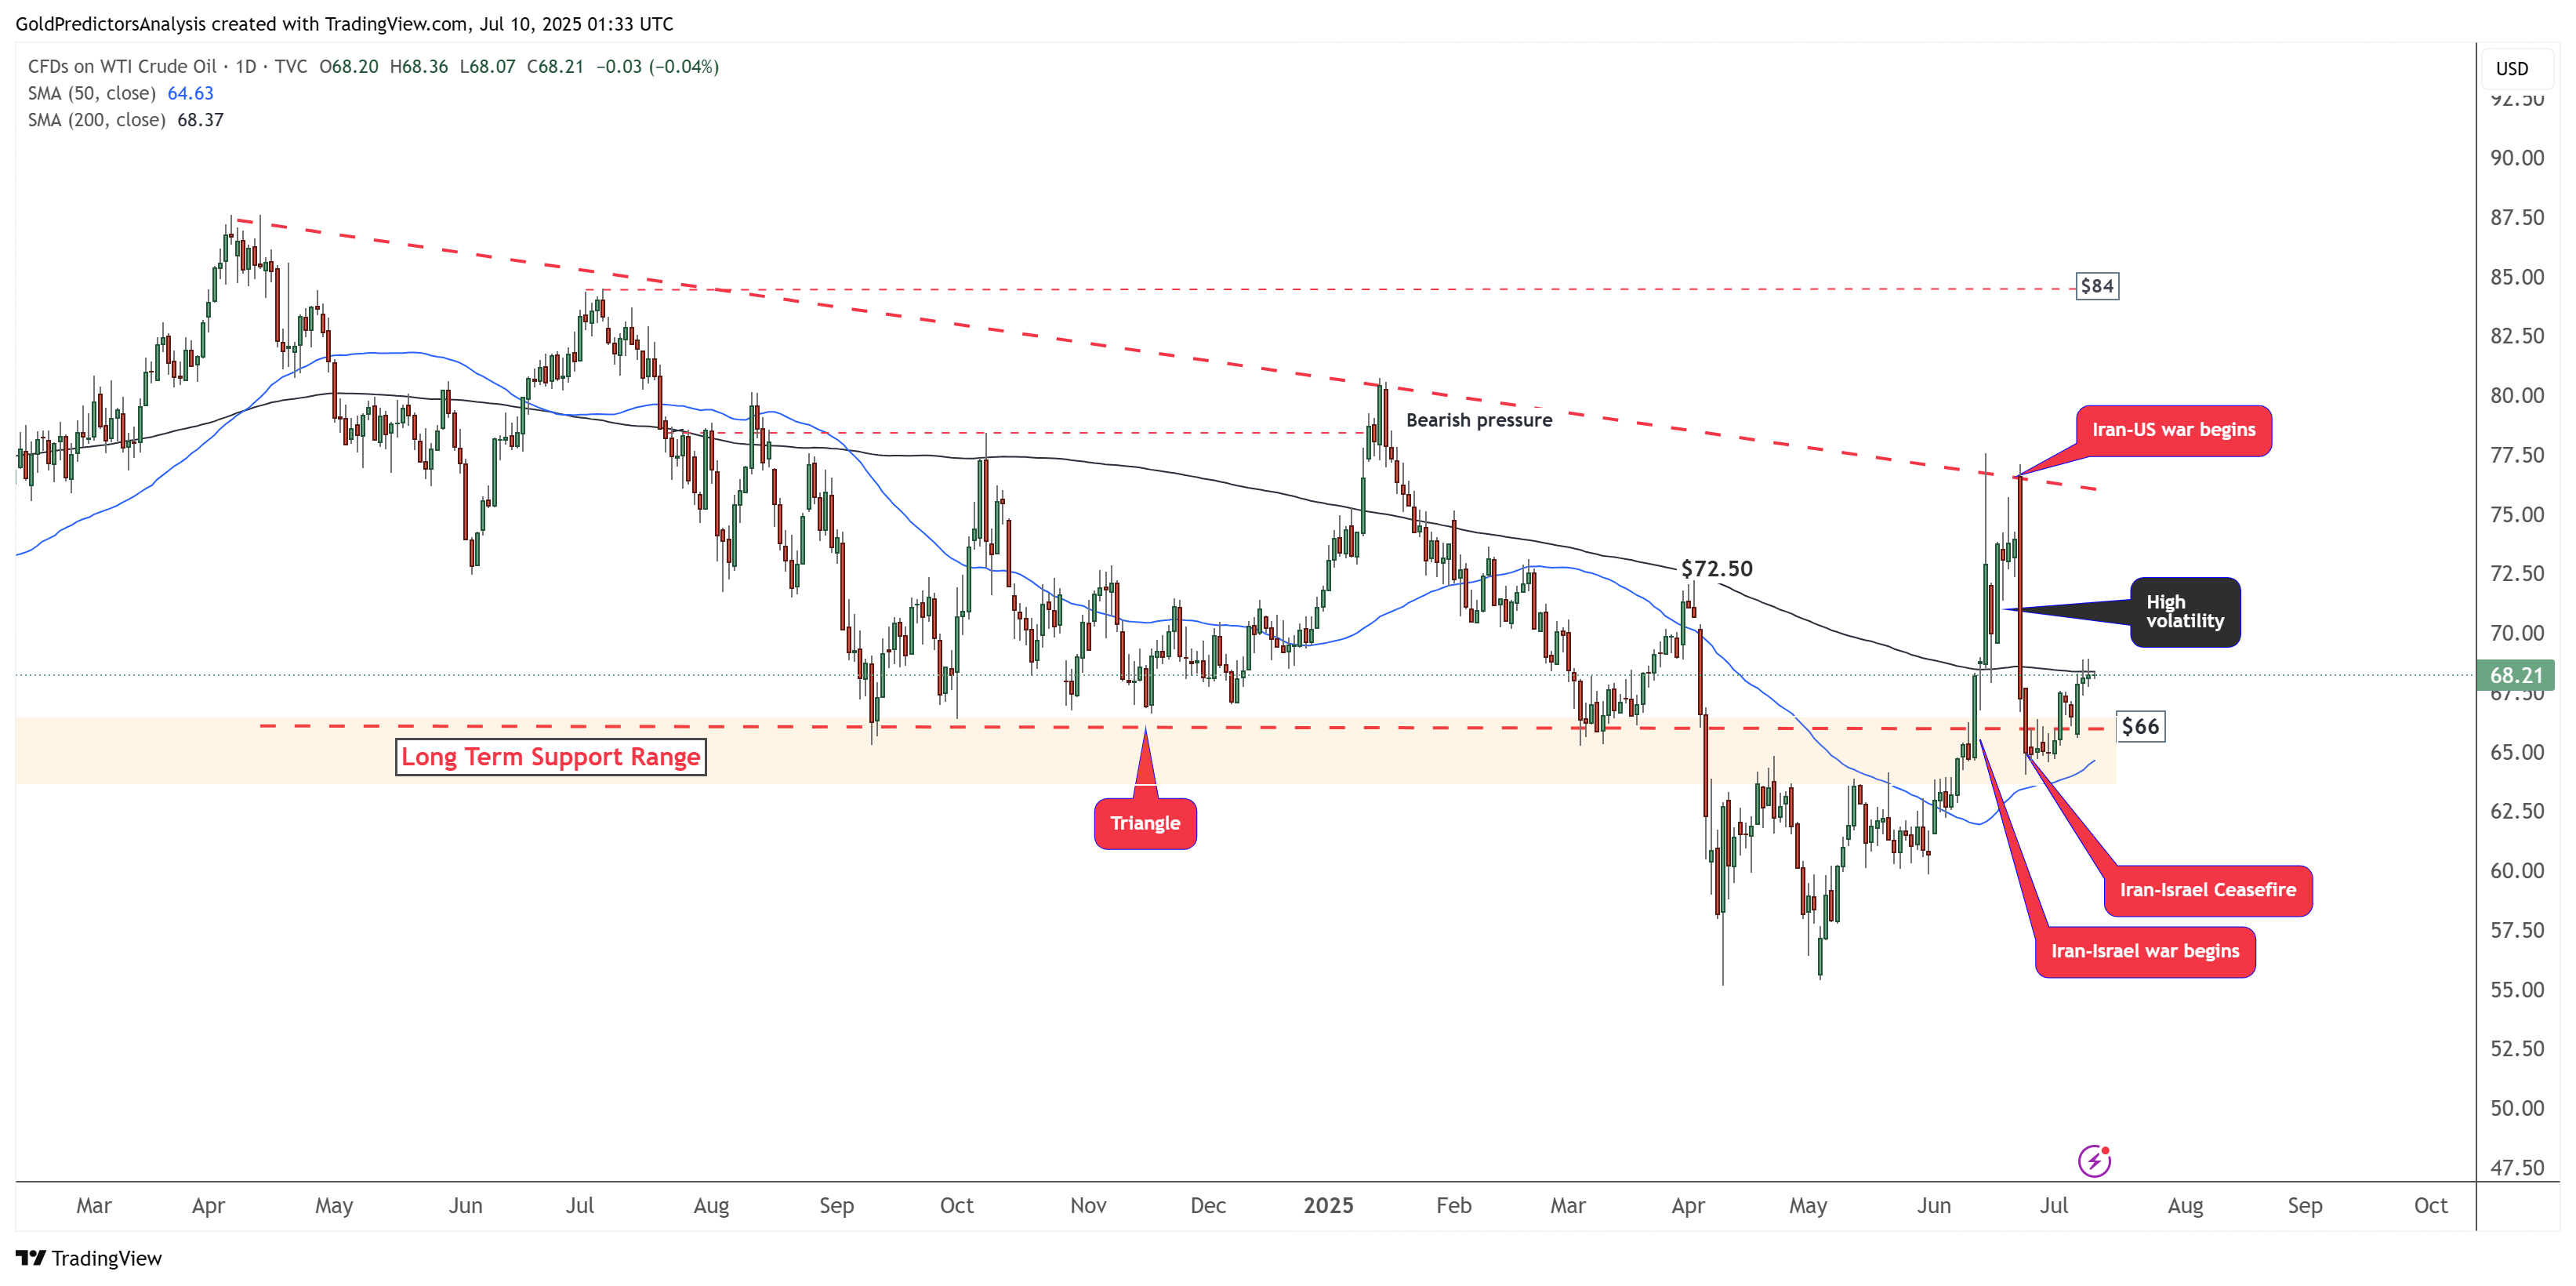
WTI Oil Daily Chart – High Volatility
The daily chart for WTI crude oil (CL) shows that the price has rebounded from the 50-day SMA and reached the 200-day SMA. The rebound from the long-term support zone around $66 reflects strong volatility. However, the overall trend remains downward. This heightened volatility is driven by ongoing uncertainty stemming from the ongoing tensions between Iran and Israel. A break above $69 would signal further upside toward the $72.50 level. However, a break above $77 is necessary to establish sustained upward momentum.
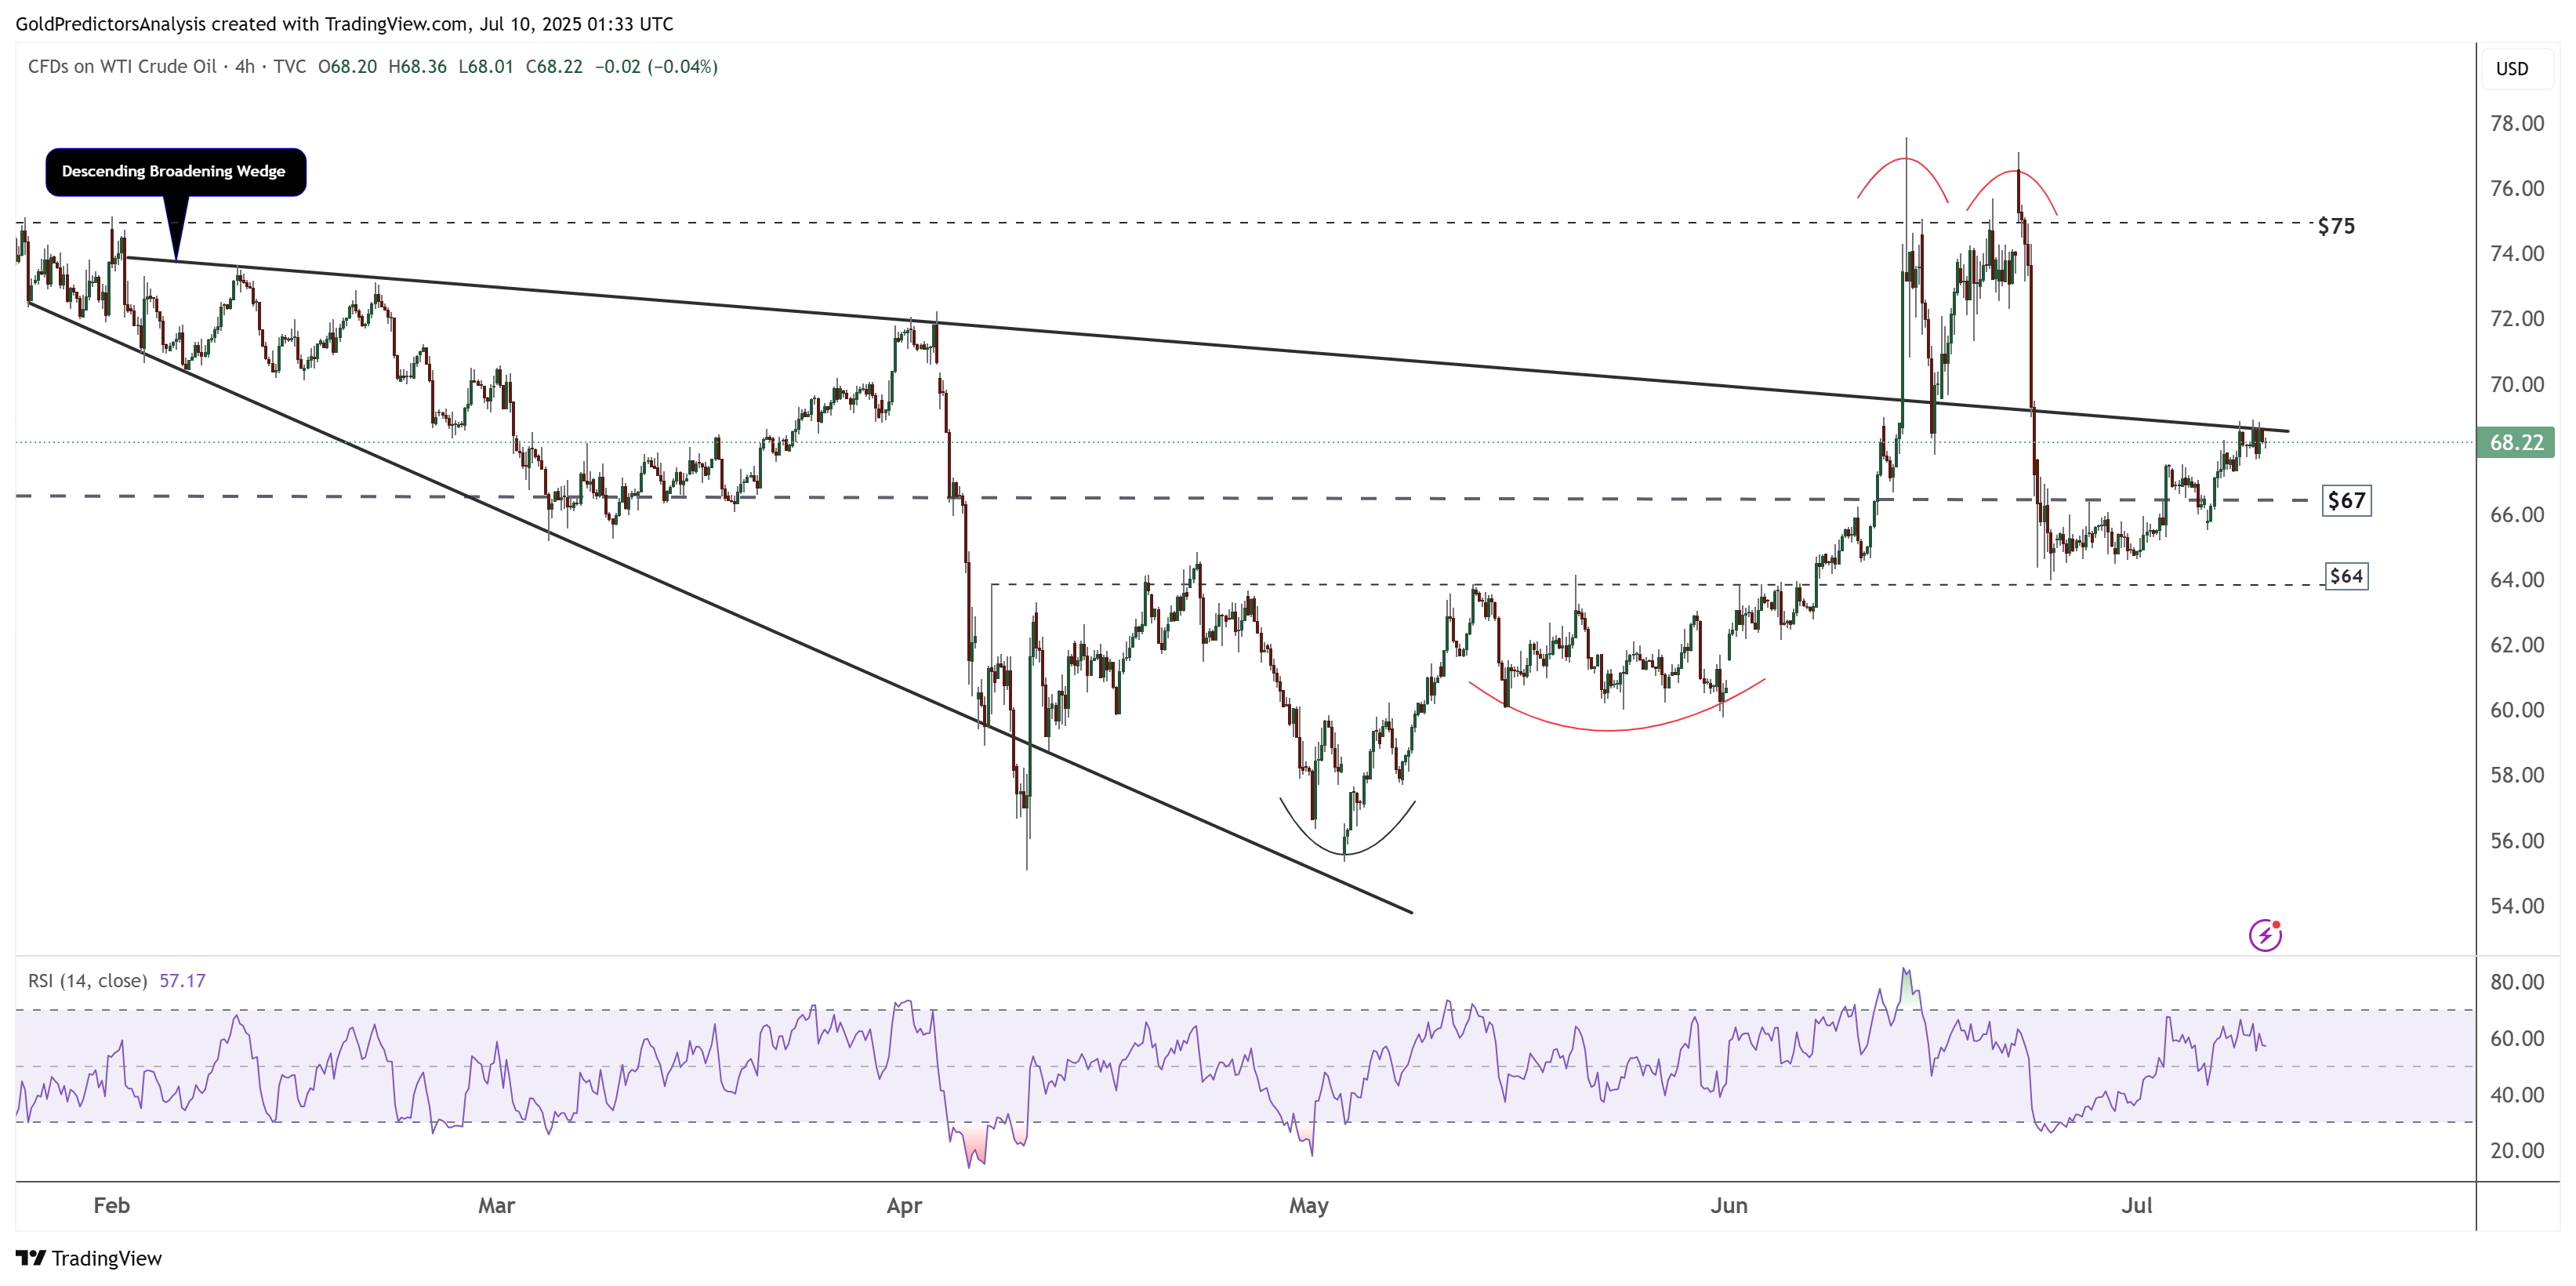
WTI Oil 4-Hour Chart – Double Top
The 4-hour chart for WTI crude oil shows that the price is consolidating within a descending broadening wedge pattern, reflecting strong uncertainty. The emergence of a double top near the $77 level, followed by a correction toward the $64 area, indicates bearish price action. However, the ongoing consolidation suggests that volatility may persist. A break below $64 would signal further downside, while a break above $77 would initiate strong upward momentum in oil prices.