 WTI Oil Daily Chart – Strong Bearish Pressure
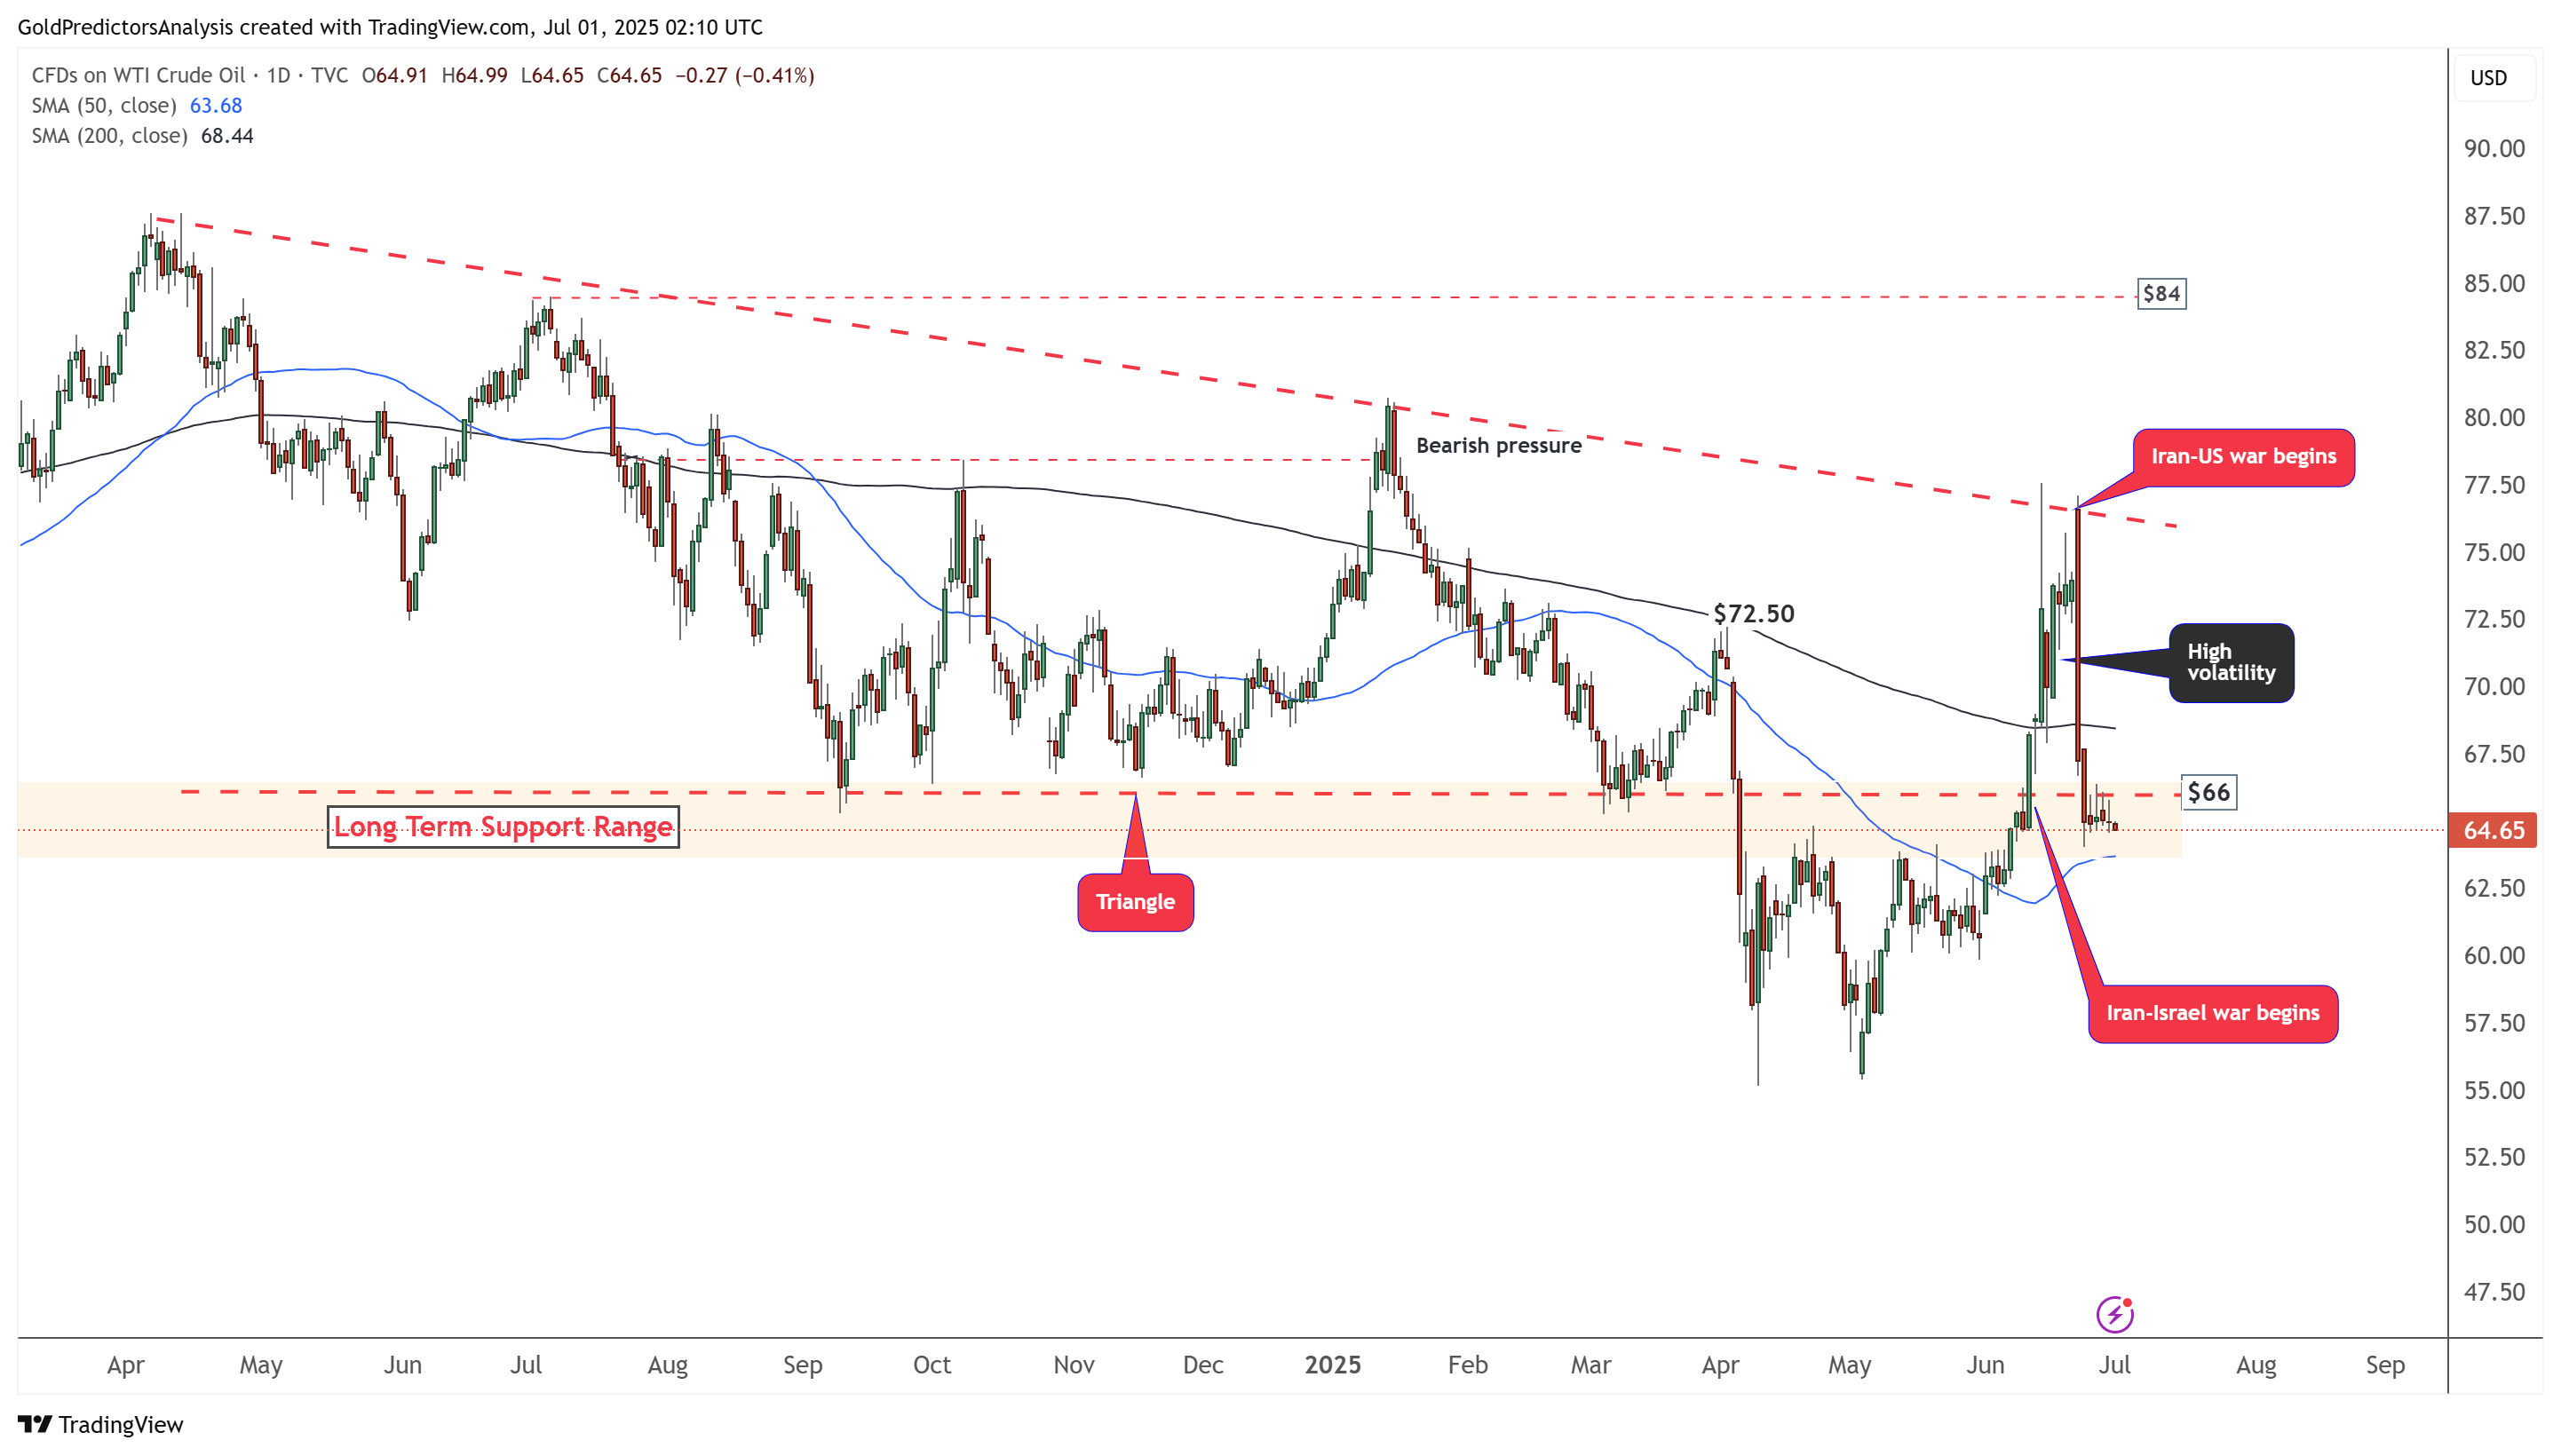
The daily chart for WTI crude oil shows that the price failed to hold above $77 following the Iran-Israel ceasefire. The price has dropped below $66 and continues to face bearish pressure. A break below the 50-day SMA near the $64 level could trigger further declines. As long as the price remains below the 200-day SMA, it is likely to continue declining.
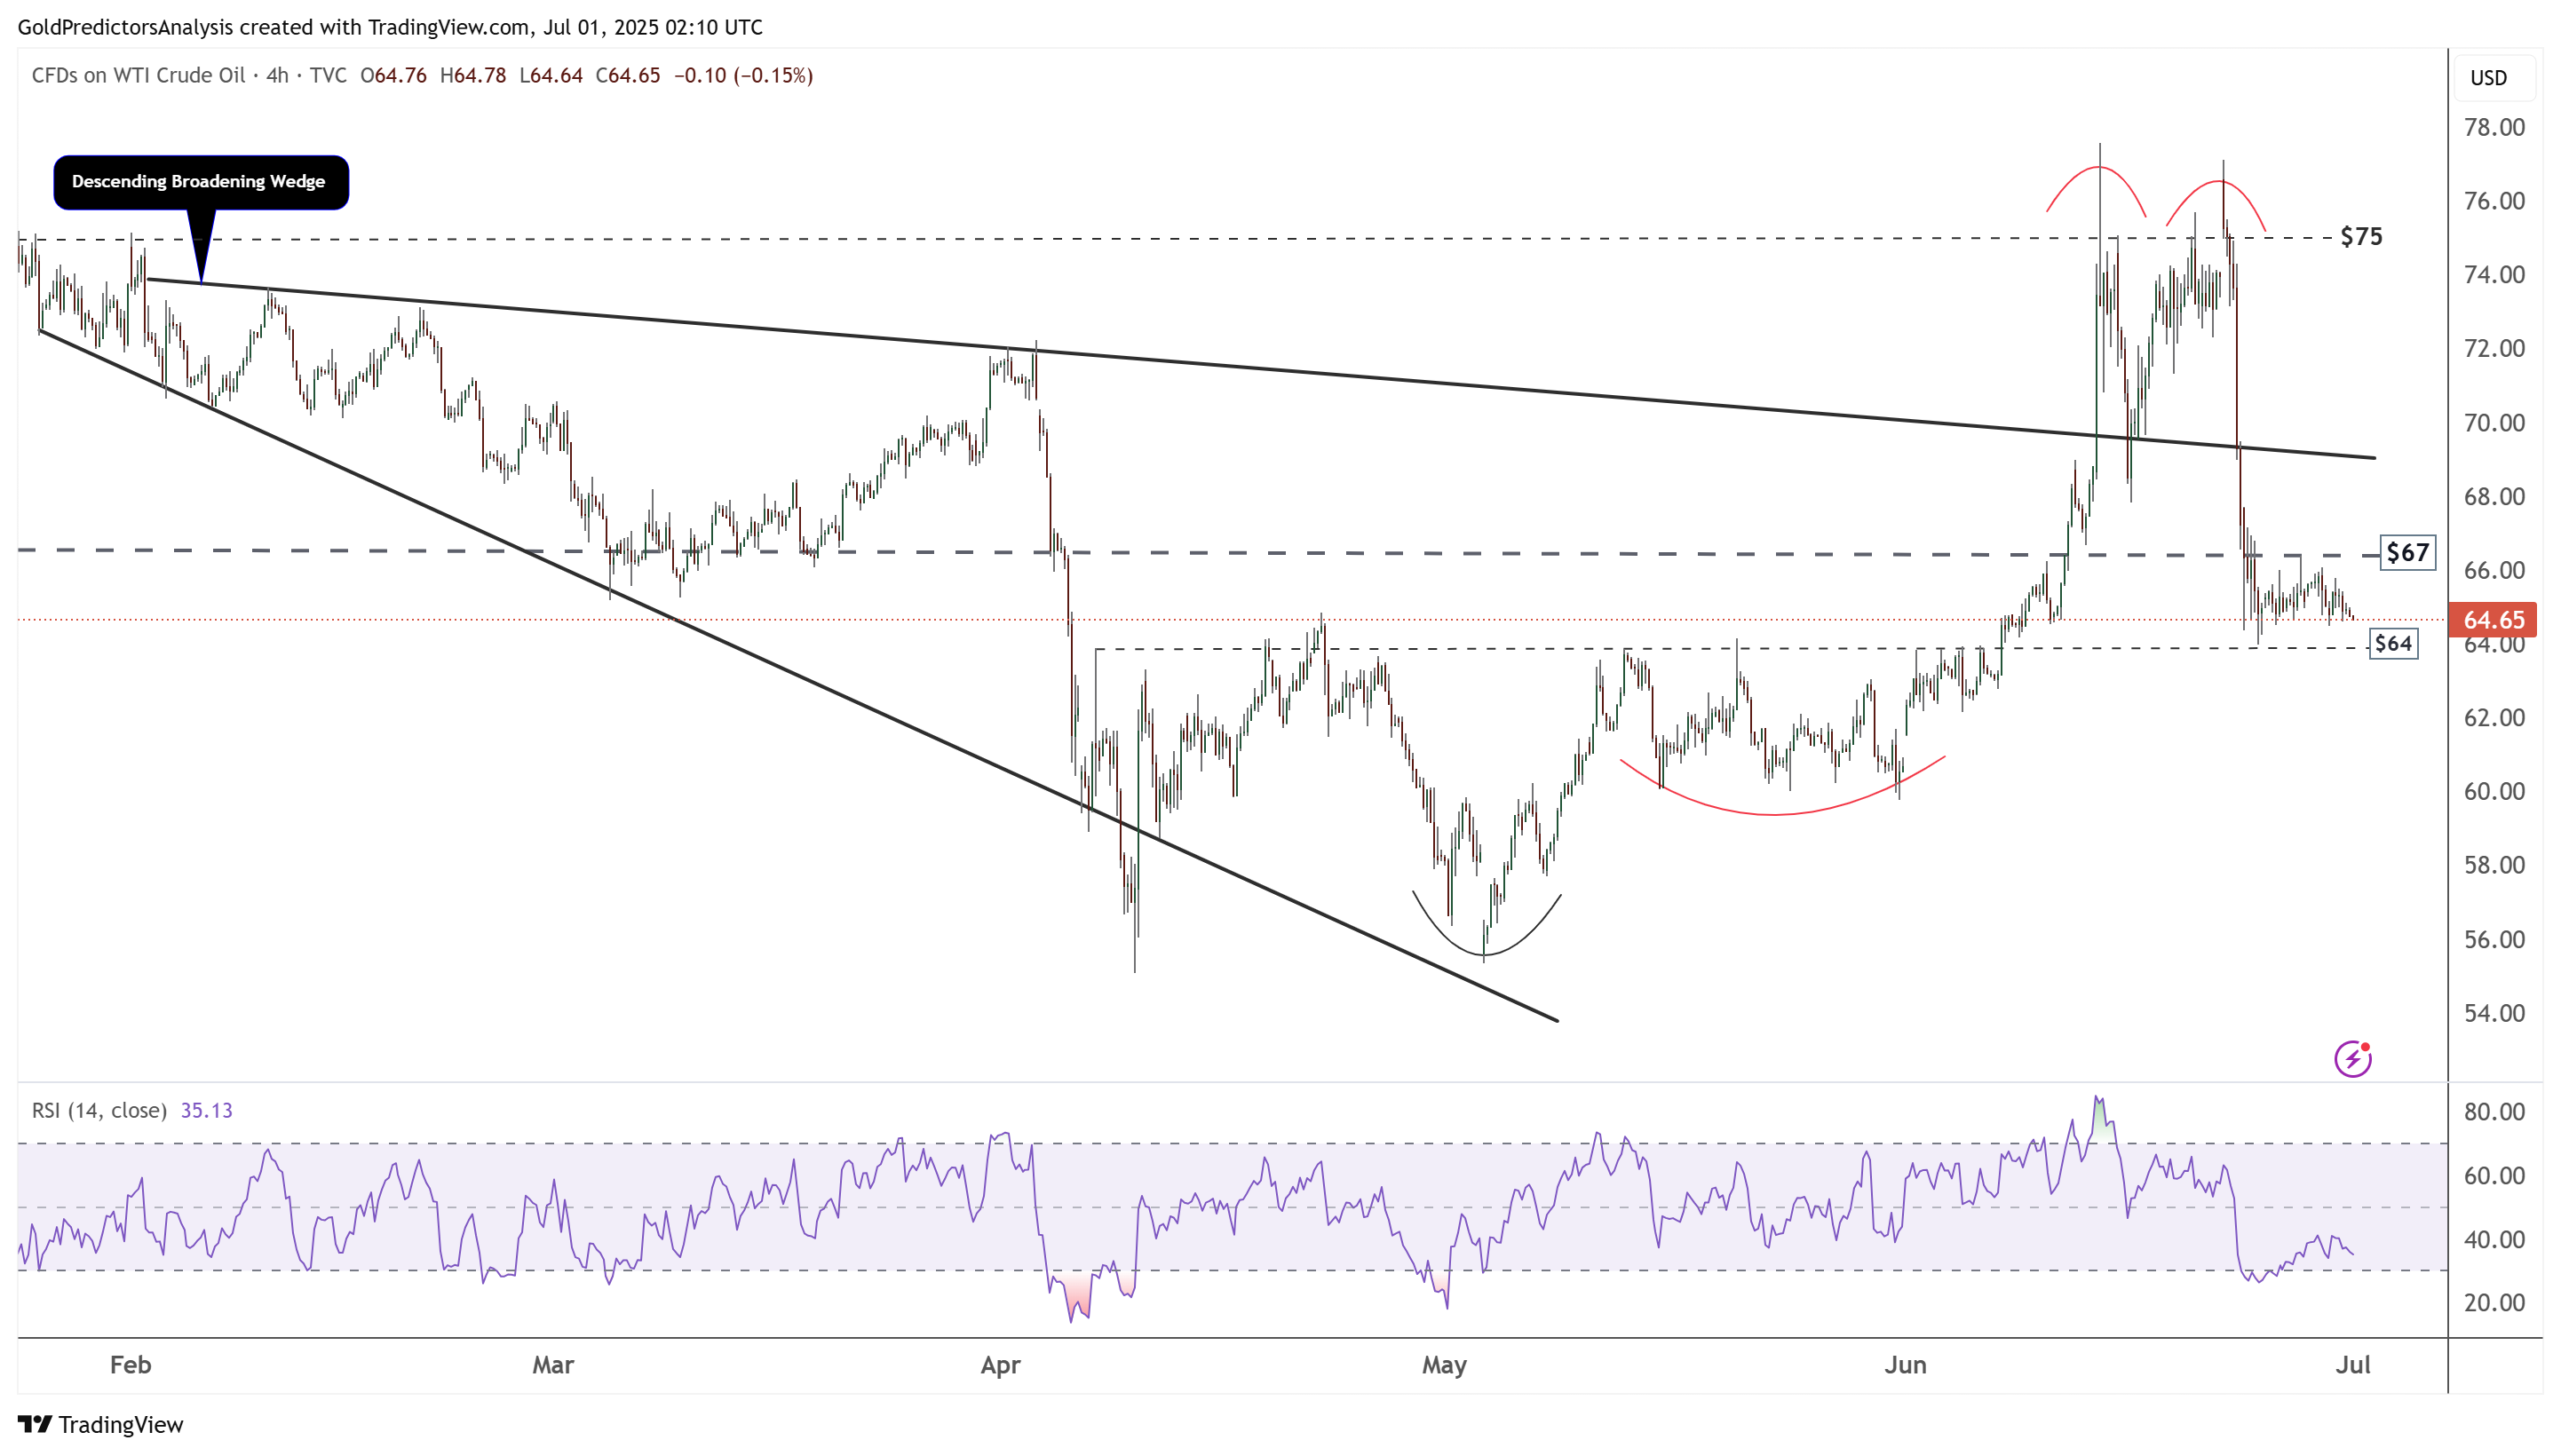
WTI Oil 4-Hour Chart – Descending Broadening Wedge
The 4-hour chart for WTI crude oil shows that the price formed a double top near the $75 to $77 resistance area. After completing the pattern, the price broke below the $67 support and is now consolidating within the $64-$67 range. A break below $64 would likely initiate further downside in WTI crude oil.