 WTI crude oil (CL) prices fell to around $61.65 in early Asian trading on Thursday. The drop followed a surprise build in US oil inventories and a stronger US Dollar. The Energy Information Administration (EIA) reported a rise of 3.454 million barrels for the week ending May 9, as shown in the chart below. This contrasts sharply with the previous week’s draw of 2.032 million barrels and market expectations of a 1.0 million-barrel decline.
The unexpected inventory build raised concerns about oversupply. Investors are reacting to signs of weakening demand amid rising stockpiles. At the same time, OPEC+ is increasing exports, with May output expected to rise by 411,000 barrels per day. This surge in supply, alongside high US inventory levels, limits any bullish momentum in oil prices.
Meanwhile, easing global trade tensions have strengthened the US Dollar. The improved sentiment has reduced recession fears, pushing the Greenback higher. The stronger dollar makes crude more expensive for foreign buyers, adding further downward pressure on WTI prices. This rising supply, unexpected stock builds, and currency strength keep the oil market under pressure.
WTI Oil Daily Chart – Rebound
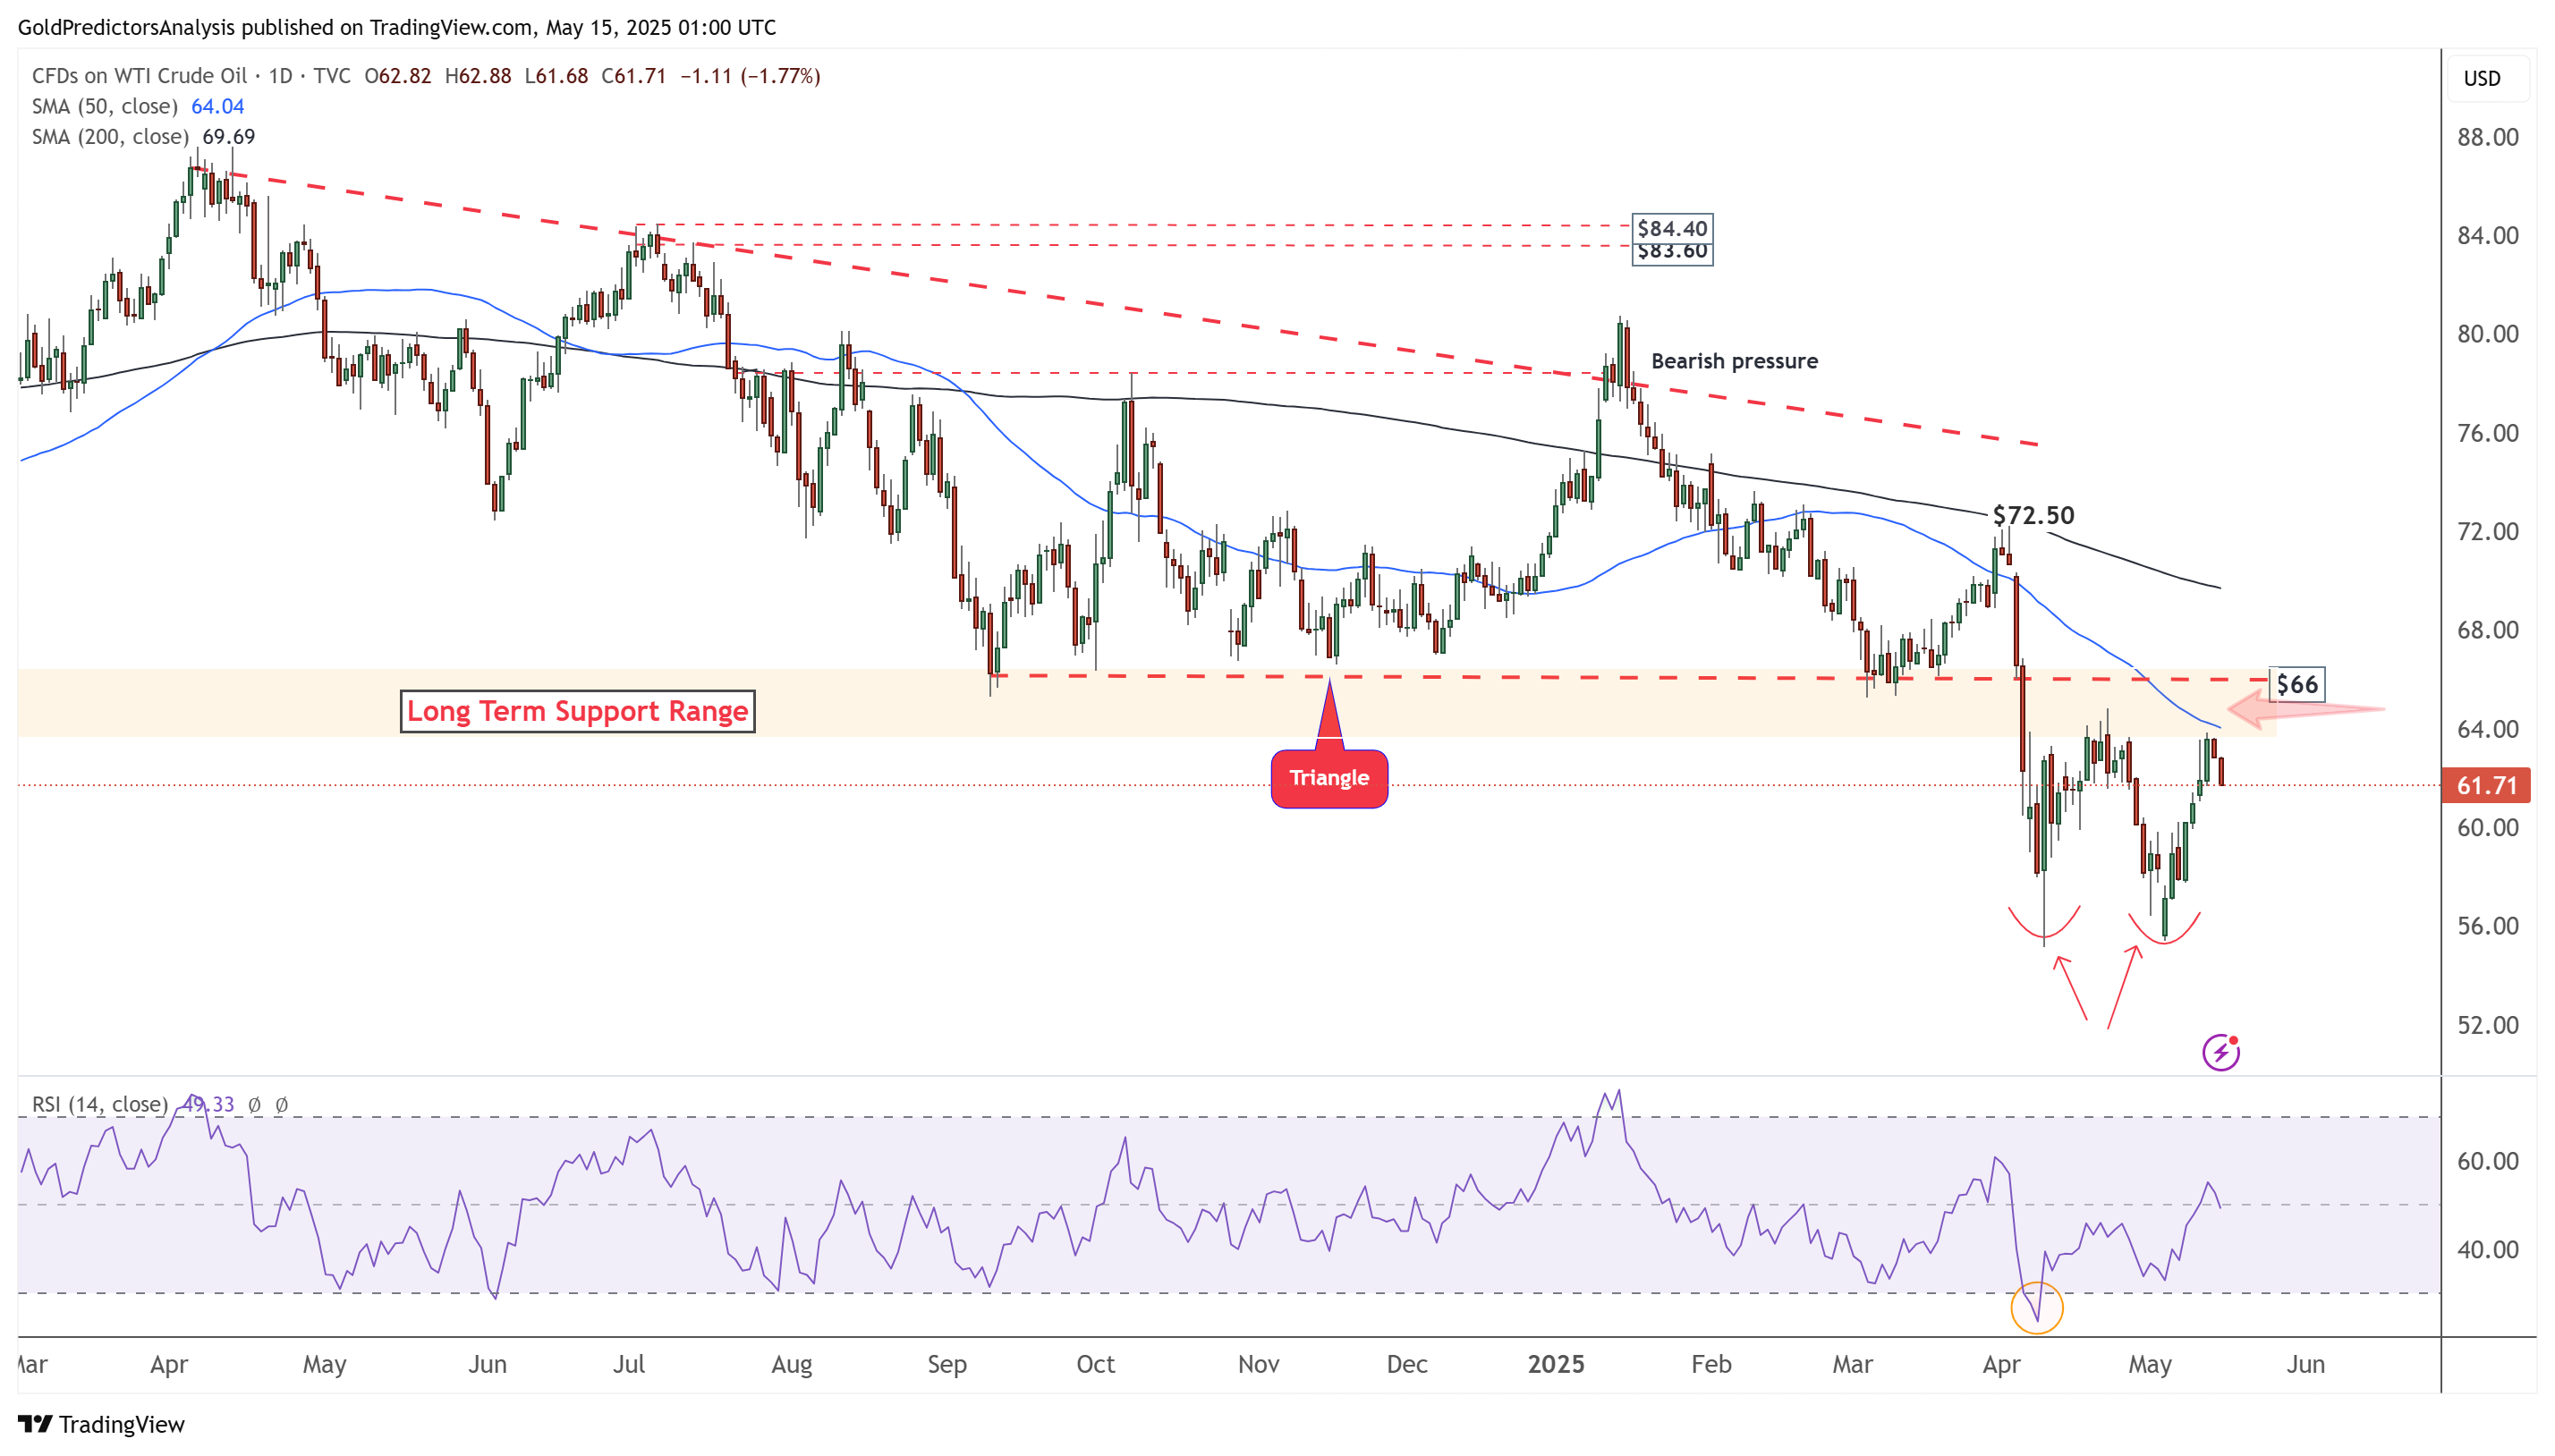
The daily chart for WTI crude oil shows that the price has rebounded toward the long-term pivotal zone of $65–$66 following the US-China trade deal. This rebound from the $55 level has formed a double bottom pattern, which will confirm a bullish move if the $66 resistance is broken. The 50-day SMA is trending below the 200-day SMA, indicating negative price action. A break above the 200-day SMA at $70 would neutralise the downward trend.
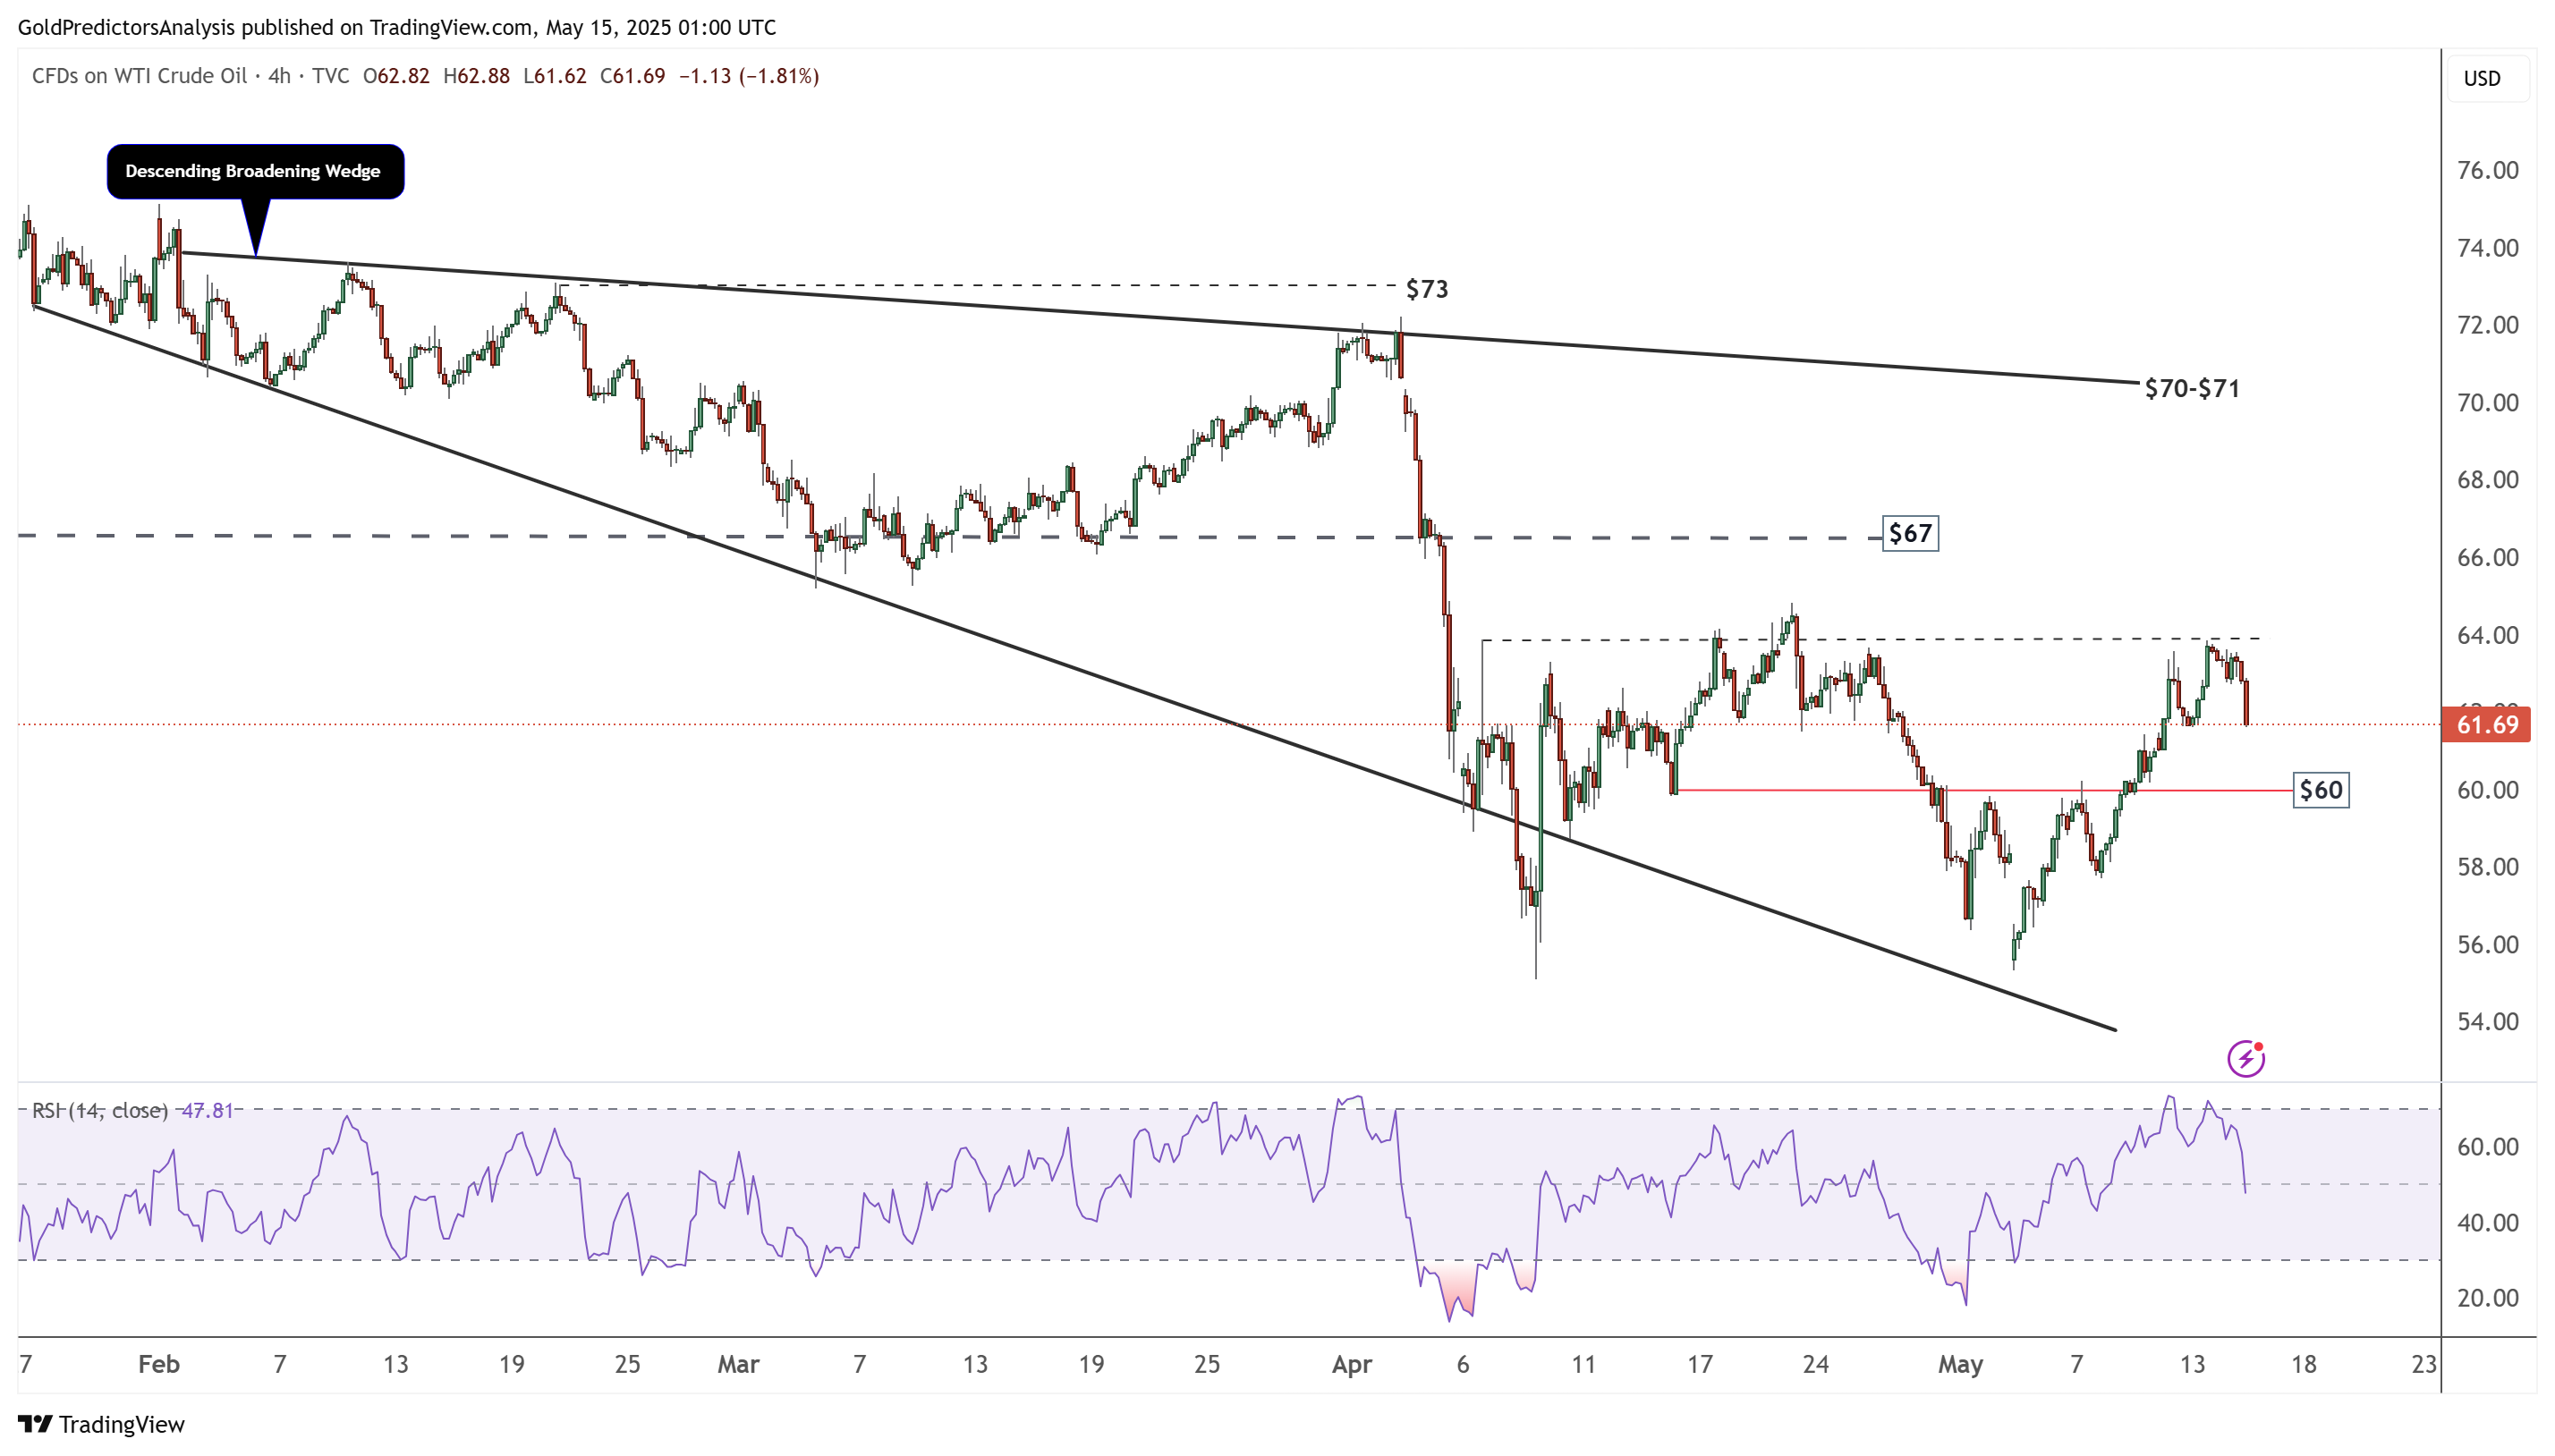
WTI Oil 4-Hour Chart – Descending Broadening Wedge
The 4-hour chart for WTI crude oil shows short-term price action, with the price consolidating within a descending broadening wedge pattern. A break above $60 has pushed the price to the resistance level at $64, where the pattern reflects strong uncertainty due to heavy volatility. A break above the descending broadening wedge at $70 is required to initiate a sustained upward trend.