 Oil Daily Chart – Bearish Pressure
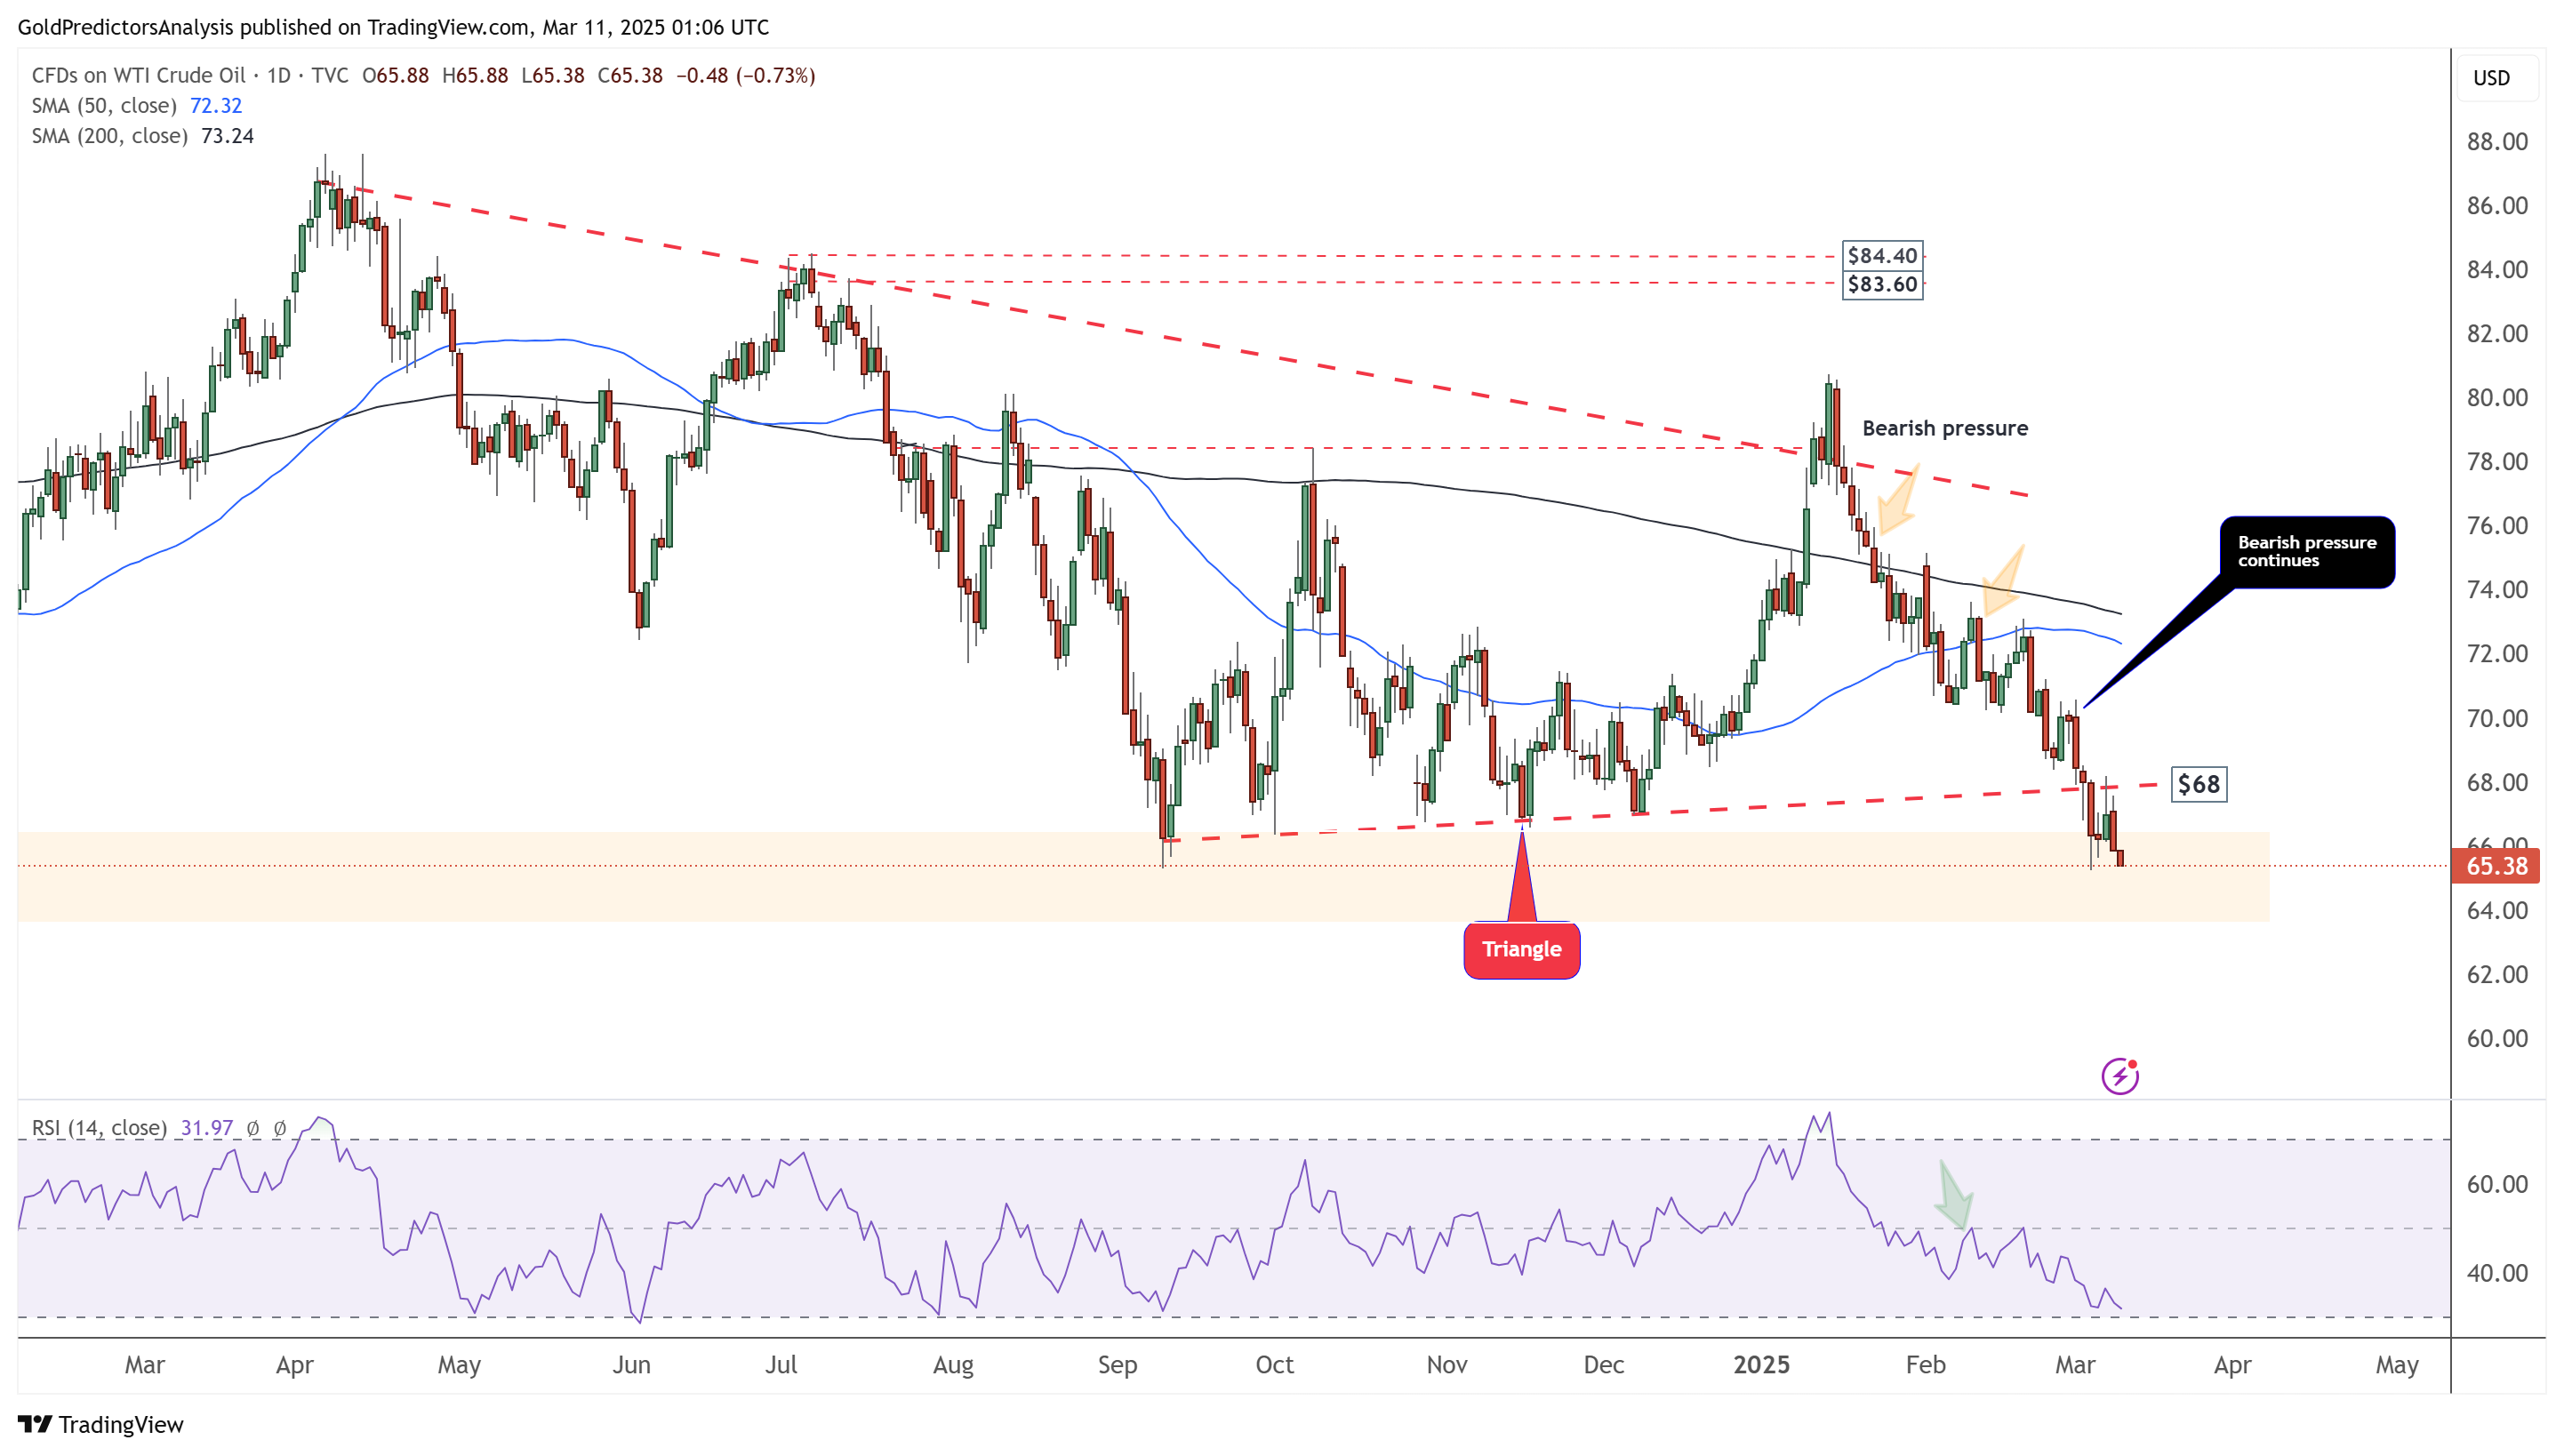
The daily chart for WTI crude oil shows that the price has broken the triangle pattern and reached long-term support around $65. After hitting this support, the price rebounded to the breakout region at $68. However, it failed to sustain its gains and appears strongly bearish, signalling a potential further drop. The 50-day SMA remains below the 200-day SMA, and the price is entering the oversold region. However, prices continue to decline after hitting the resistance of the red-dotted trend line, which indicates a further drop.
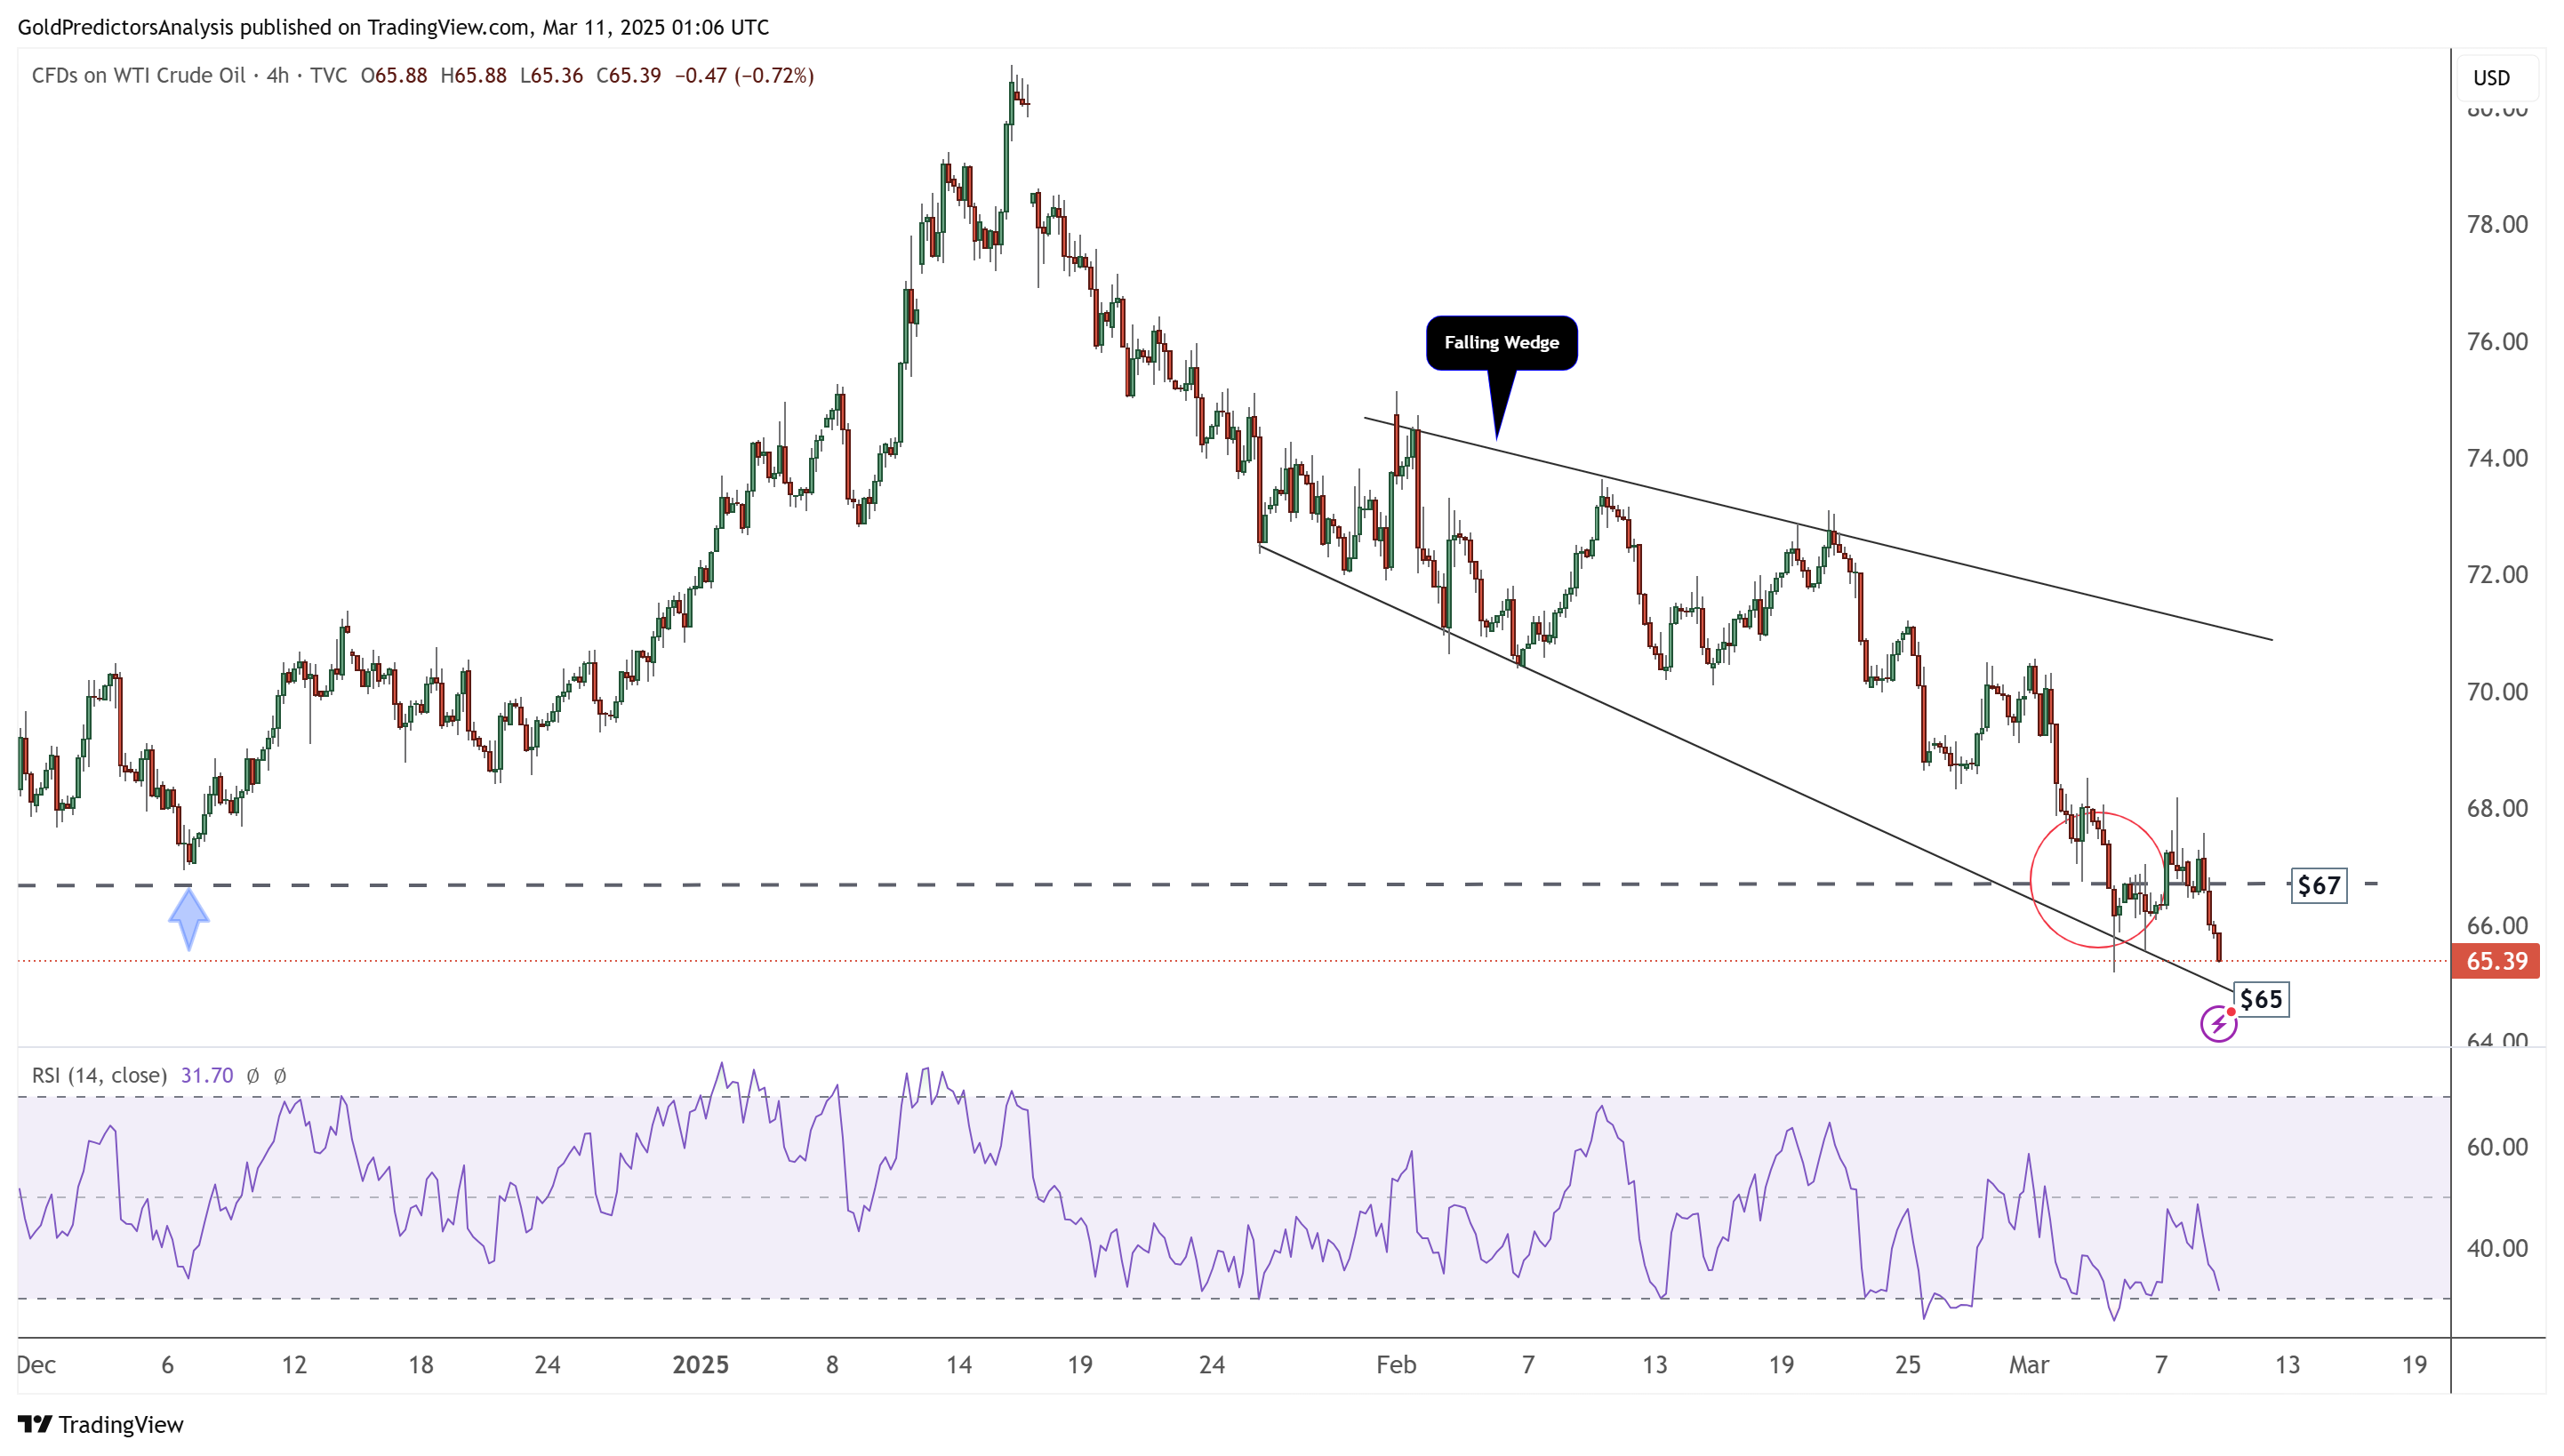
Oil 4-Hour Chart – Bearish Pressure
The 4-hour chart shows that the price rebounded from the support of the falling wedge but continues to trend downward. The RSI has hit the mid-level, indicating a likely further downside. As long as the price remains below $72.50, oil prices will likely stay under bearish pressure.