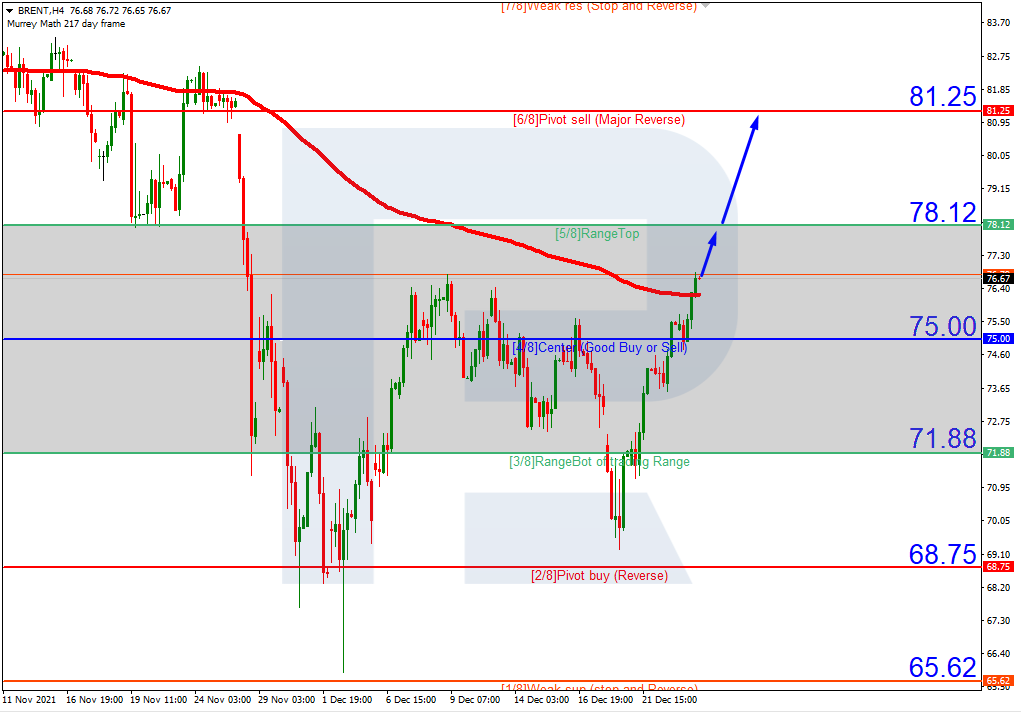
 In the H4 chart, after breaking the 200-day Moving Average, Brent is trading above it, thus indicating an ascending tendency. In this case, the price is expected to test 5/8, break it, and then continue growing towards the resistance at 6/8. However, this scenario may no longer be valid if the asset breaks 4/8 to the downside. After that, the instrument may fall and reach the support at 3/8.
As we can see in the M15 chart, the pair has broken the downside line of the VoltyChannel indicator and, as a result, may continue trading upwards.
Orgin: RoboForex