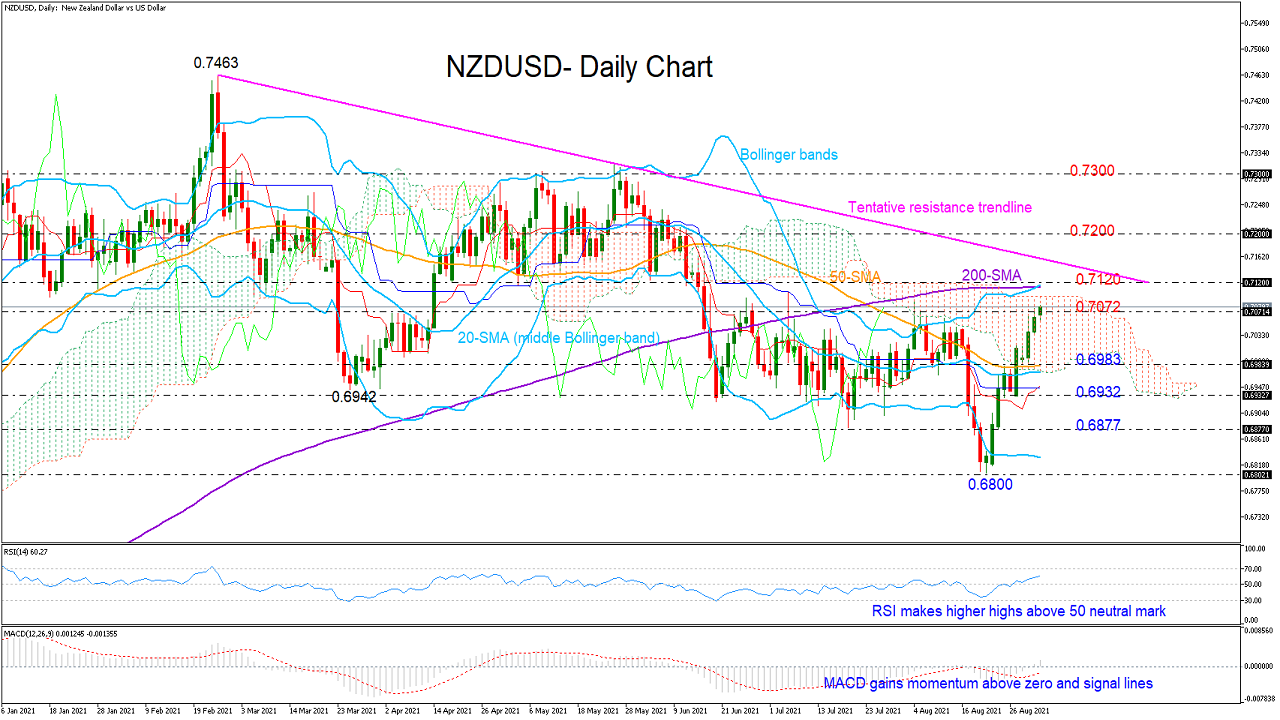
 NZDUSD has been one of the best performers among major FX pairs this week, extending its bullish run to an almost one-month high of 0.7075 after finding support near the 50-day simple moving average (SMA).
The market action is currently taking place around the crucial resistance of 0.7072, while within breathing distance, the 200-day SMA at 0.7120 and a tentative descending trendline at 0.7145 is another key wall, which the bulls need to knock down in order to speed up towards the 0.7200 number. Beyond the latter, the spotlight will shift to the 0.7300 level.
According to the momentum indicators, upside pressures could persist in the short term as the RSI has overcome its July peak and is strengthening comfortably above its 50 neutral mark. The MACD continues to gain ground within the positive area and above its red signal line, while the price itself has still some way to go to reach the upper Bollinger band, both adding to the bullish signals.
Nevertheless, if the 0.7072 – 0.7120 area proves hard to escape, the pair could revisit the 50-day SMA at 0.6983. If this floor cracks, the next stop could be around last week’s support of 0.6932, while lower, the bears will need to close below 0.6877 before they head for the 0.6800 bottom.
In brief, NZDUSD is expected to gather additional buying interest in the short term. A clear move above the 200-day SMA and the resistance trendline could add more fuel to the rally.
Origin: XM