


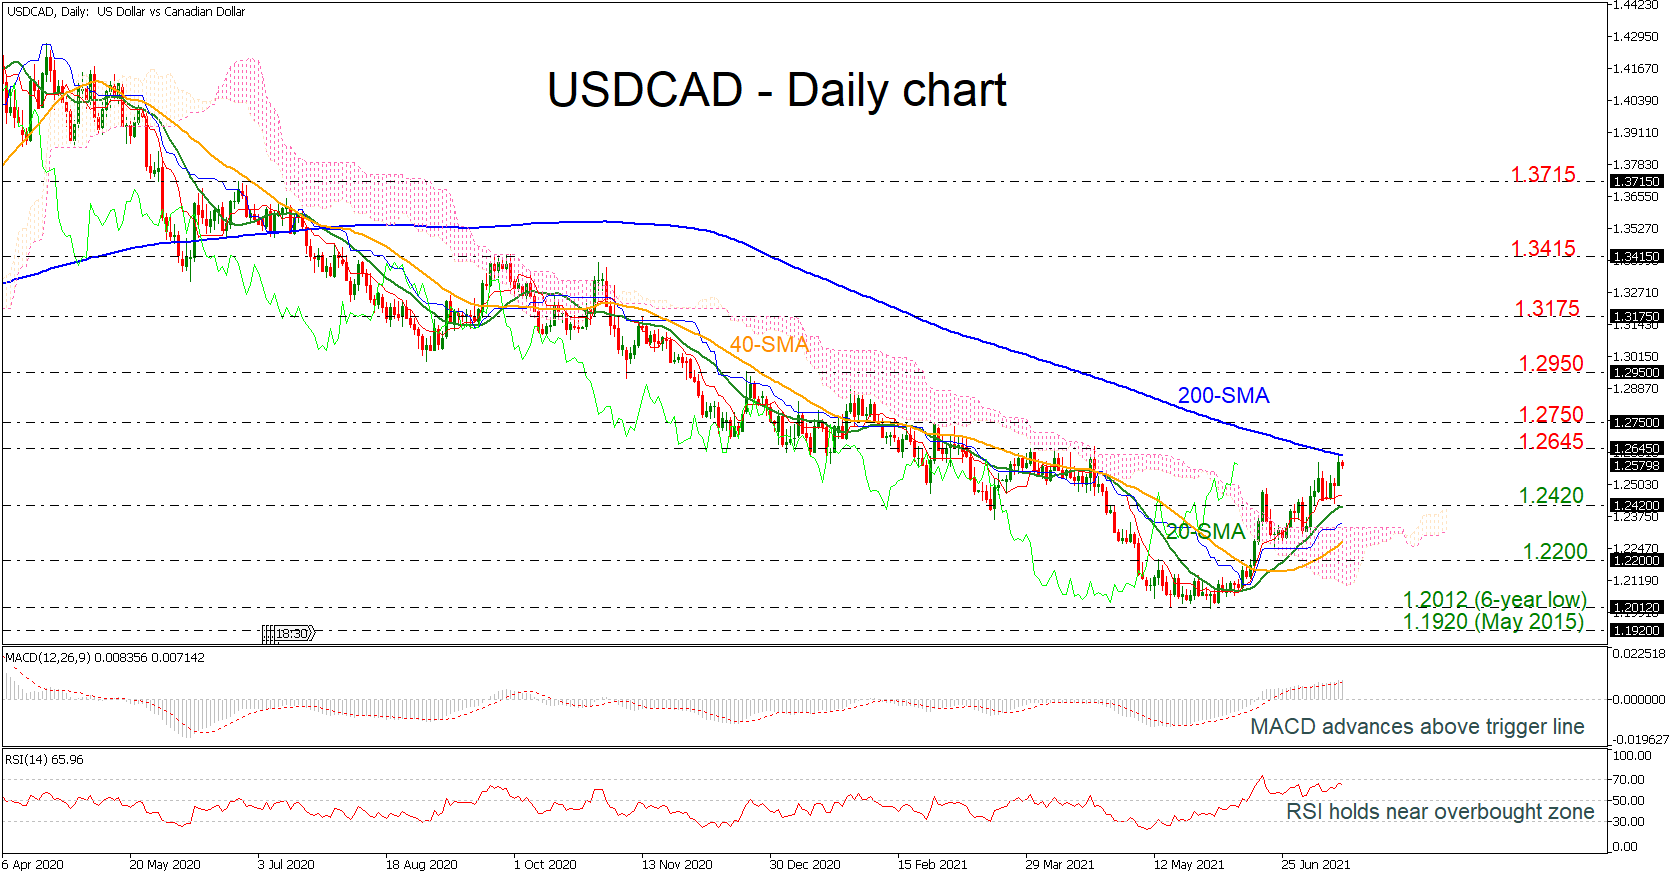
 USDCAD has found strong resistance at the 200-day simple moving average (SMA) and is reversing slightly to the downside today. The RSI is confirming the recent negative move as it is pointing south in the positive territory; however, the MACD is stretching its bullish momentum above its trigger and zero lines.
In the case that the 200-day SMA acts as a significant turning point, it could send the price lower again towards the 1.2420 support, which coincides with the 20-day SMA. Even lower, the Ichimoku cloud and the 40-day SMA around 1.2275 could attract attention before slipping towards the 1.2200 psychological number. Underneath these obstacles, the six-year low of 1.2012 may pause the long-term bearish tendency.
In the positive window, the price may overcome the 200-day SMA and the 1.2645 resistance, hitting the 1.2750 barrier ahead of 1.2950, registered in December 2020. More increases could switch the broader bearish outlook to bullish, resting near 1.3175.
In conclusion, in the short-term, USDCAD has been in a bullish mode after the rebound off 1.2012 and any climbs above the key line of the 200-day SMA may open the way for more positive actions in the longer timeframe as well.
Origin: XM


