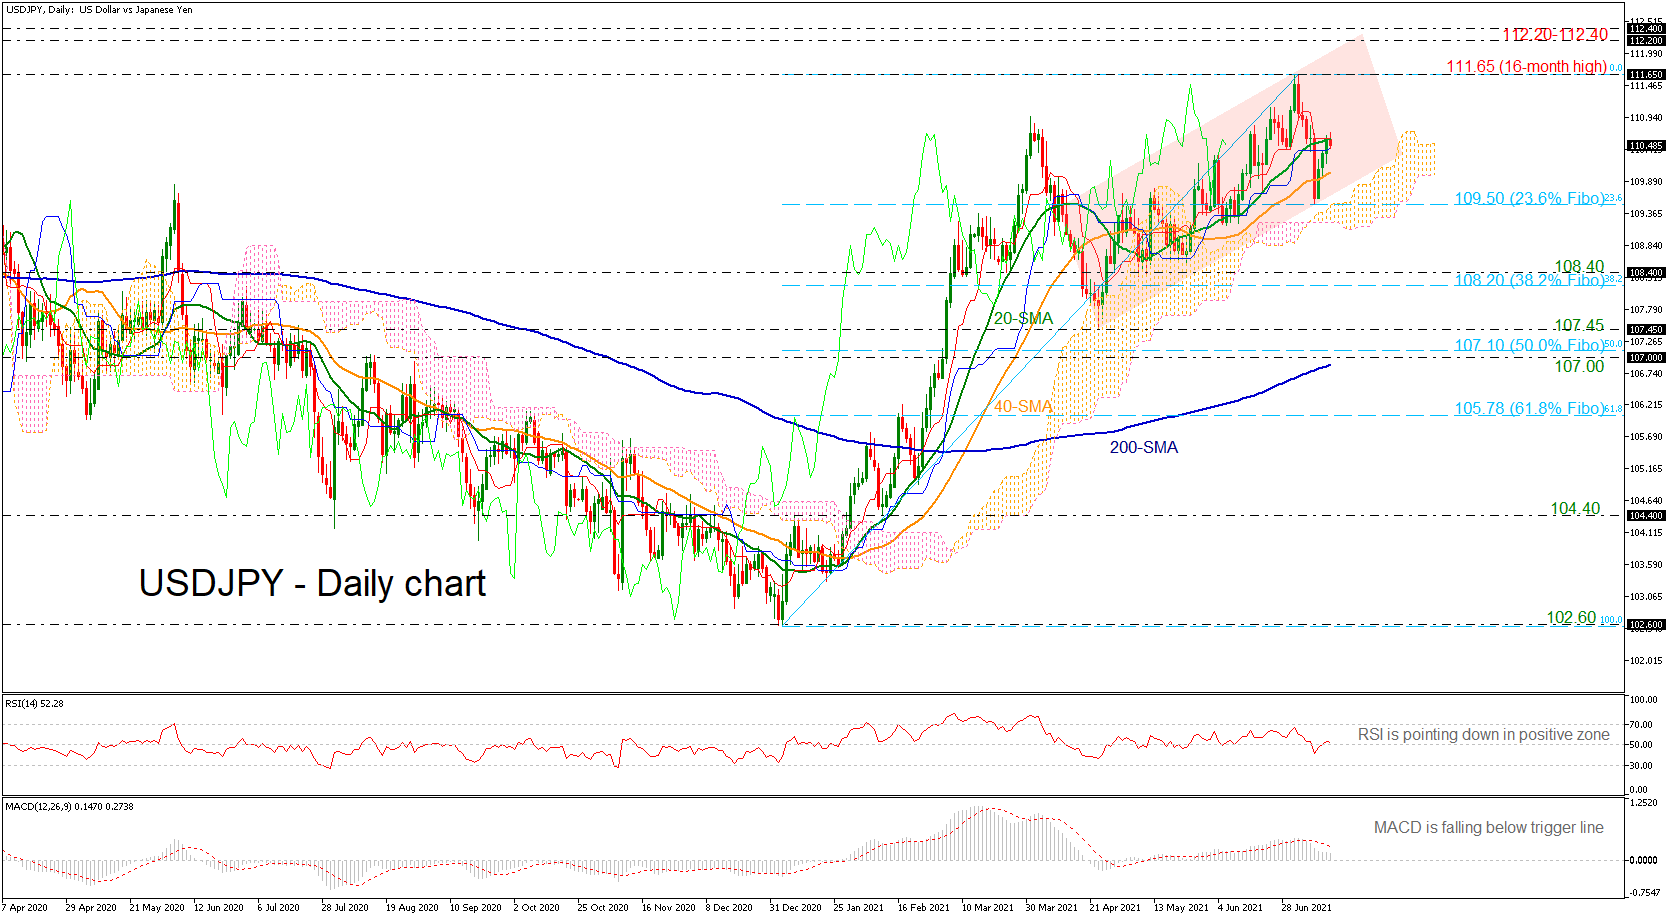
 USDJPY is facing strong resistance at the 20-day simple moving average (SMA) near 110.60, looking set for a red session after three consecutive green days.
Previously, the 23.6% Fibonacci retracement level of the up leg from 102.60 to 111.65 at 109.50 managed to defend the bulls, holding the price within an ascending channel.
Looking at the technical indicators, the RSI is pointing south, ready to cross back below its 50 neutral mark, while the MACD is losing momentum in the positive region.
If the pair successfully jumps above the short-term 20-day SMA, the next target could be the 16-month peak of 111.65. Higher, the pair could revisit the 112.20-112.40 zone.
On the flip side, a tumble beneath the 40-day SMA could take the price until the 23.6% Fibo of 109.50 and then towards the lower surface of the Ichimoku cloud at 109.08. Breaking these lines, the 108.40 level and the 38.2% Fibo of 108.20 could come into the spotlight, shifting the bias to neutral.
All in all, USDJPY has been in a rising channel since April 23. Any decline below the cloud may switch the broader outlook to neutral and a drop beneath the 200-day SMA could turn the view to bearish.
Origin: XM