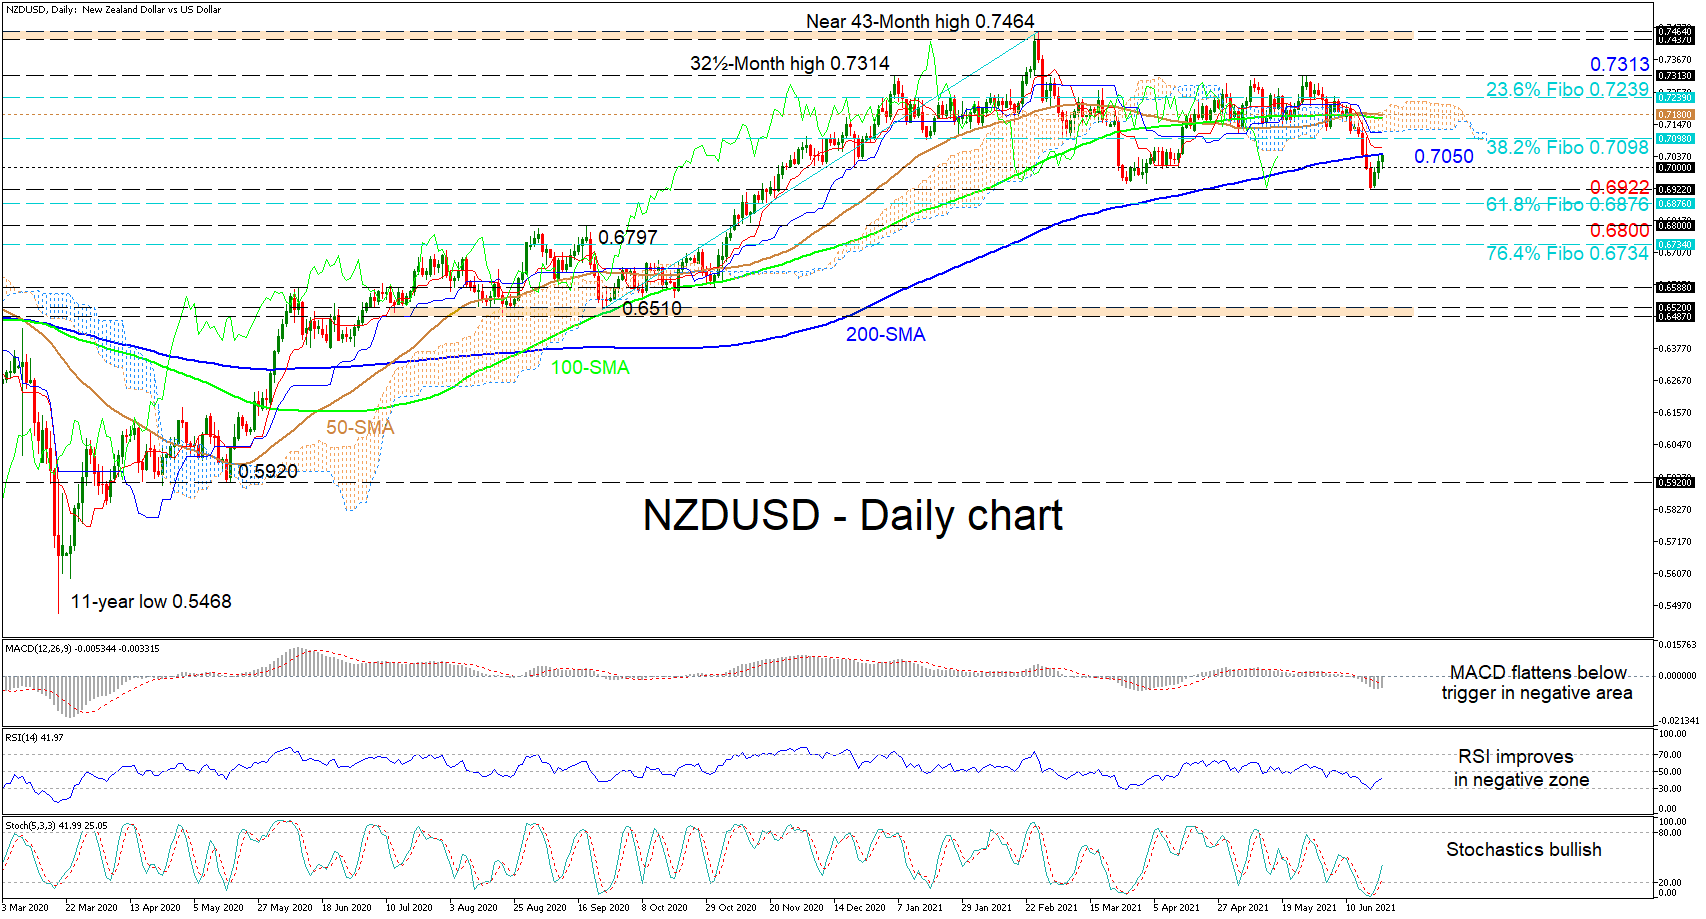
 NZDUSD is looking set to return above the 200-day simple moving average (SMA) after buyers managed to successfully log two consecutive days in the green, beginning from 0.6922. Although the intertwined 50- and 100-day SMAs are suggesting a largely neutral tone, and the break beneath the 200-day SMA is a bearish signal, negative impetus seems to have become feeble.
The Ichimoku lines are also indicating that negative pressures are subsiding, while the short-term oscillators are confirming that positive momentum is growing. The MACD is nearing its red trigger line in the negative region, while the RSI is hiking towards the 50 threshold. Moreover, the positively charged stochastic oscillator is endorsing bullish price action.
If the pair remains northbound, immediate upside constraints could transpire from the 200-day SMA at 0.7050 and the red Tenkan-sen line overhead. Trying to further offset recently lost ground, buyers may then encounter a cluster of resistance from the 0.7098 level until the 50-day SMA at 0.7180, the former being the 38.2% Fibonacci retracement of the up leg from 0.6510 until 0.7464. Should the price surpass the Ichimoku cloud as well, its next upside obstacle could occur at the 23.6% Fibo of 0.7239, with persistent buyers quickly challenging the 0.7313 high.
If the 200-day SMA opposes additional advances and the price slips below the 0.7000 handle, support could commence at the 0.6922 trough and the 61.8% Fibo of 0.6876, slightly lower. Then if the decline gains momentum, the key 0.6800 hurdle could try to impede a deeper retracement from unfolding towards the 76.4% Fibo of 0.6734.
As things stand, NZDUSD’s positive structure has yet to fully break down. This remains true should the price persist above the 0.6922 trough and the 61.8% Fibo of 0.6876, with a price jump above the 200-day SMA reinforcing optimism in the pair.
Origin: XM