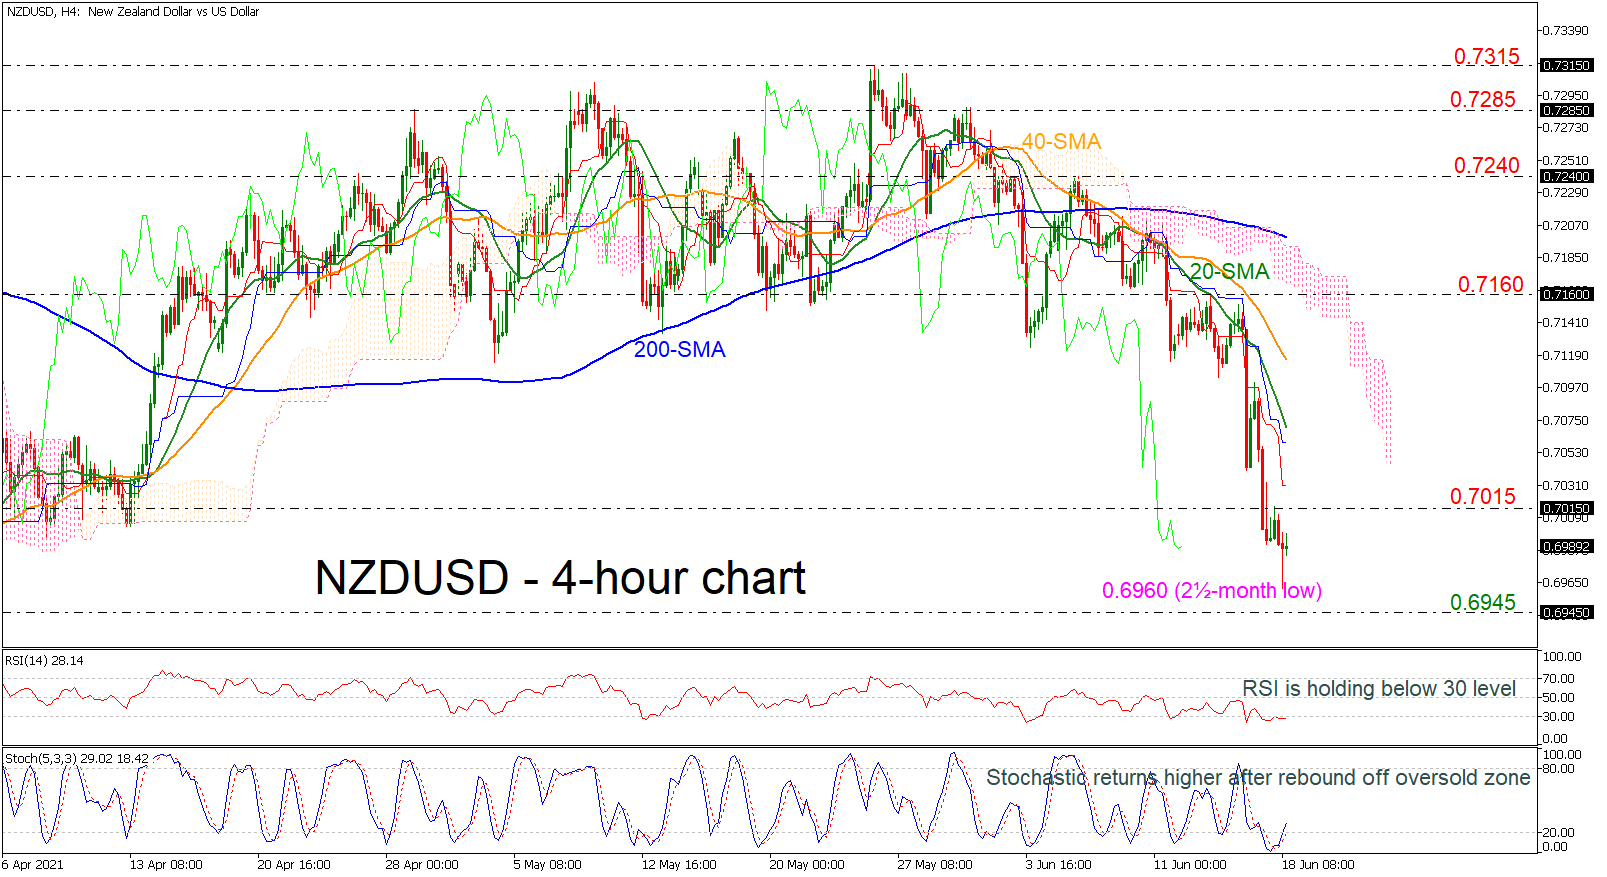
 NZDUSD is reversing quickly to the upside after the sharp plummet towards a fresh two-and-a-half-month low of 0.6960 earlier today.
The RSI is flattening in the oversold territory; however, the stochastic is ticking higher after the drop into the negative zone. The Ichimoku indicator is signaling more losses in the market, so are the 20- and 40-period simple moving averages (SMAs).
In case of more bullish actions, immediate resistance could come from the 0.7015 barrier before moving towards the red Tenkan-sen line and the blue Kijun-sen line at 0.7030 and 0.7060 respectively. Even higher, the 20- and 40-period SMAs could attract attention at 0.7080 and 0.7120 ahead of the 0.7160 resistance level.
On the other side, steeper declines could test the 0.6945 support, taken from the inside swing high from November 2018 before challenging the top from September 2018 at 0.6795.
To conclude, NZDUSD has been in a strong negative tendency over the last three weeks and only a climb above the 200-period SMA at 0.7200 might shift this view to slightly bullish.
Origin: XM