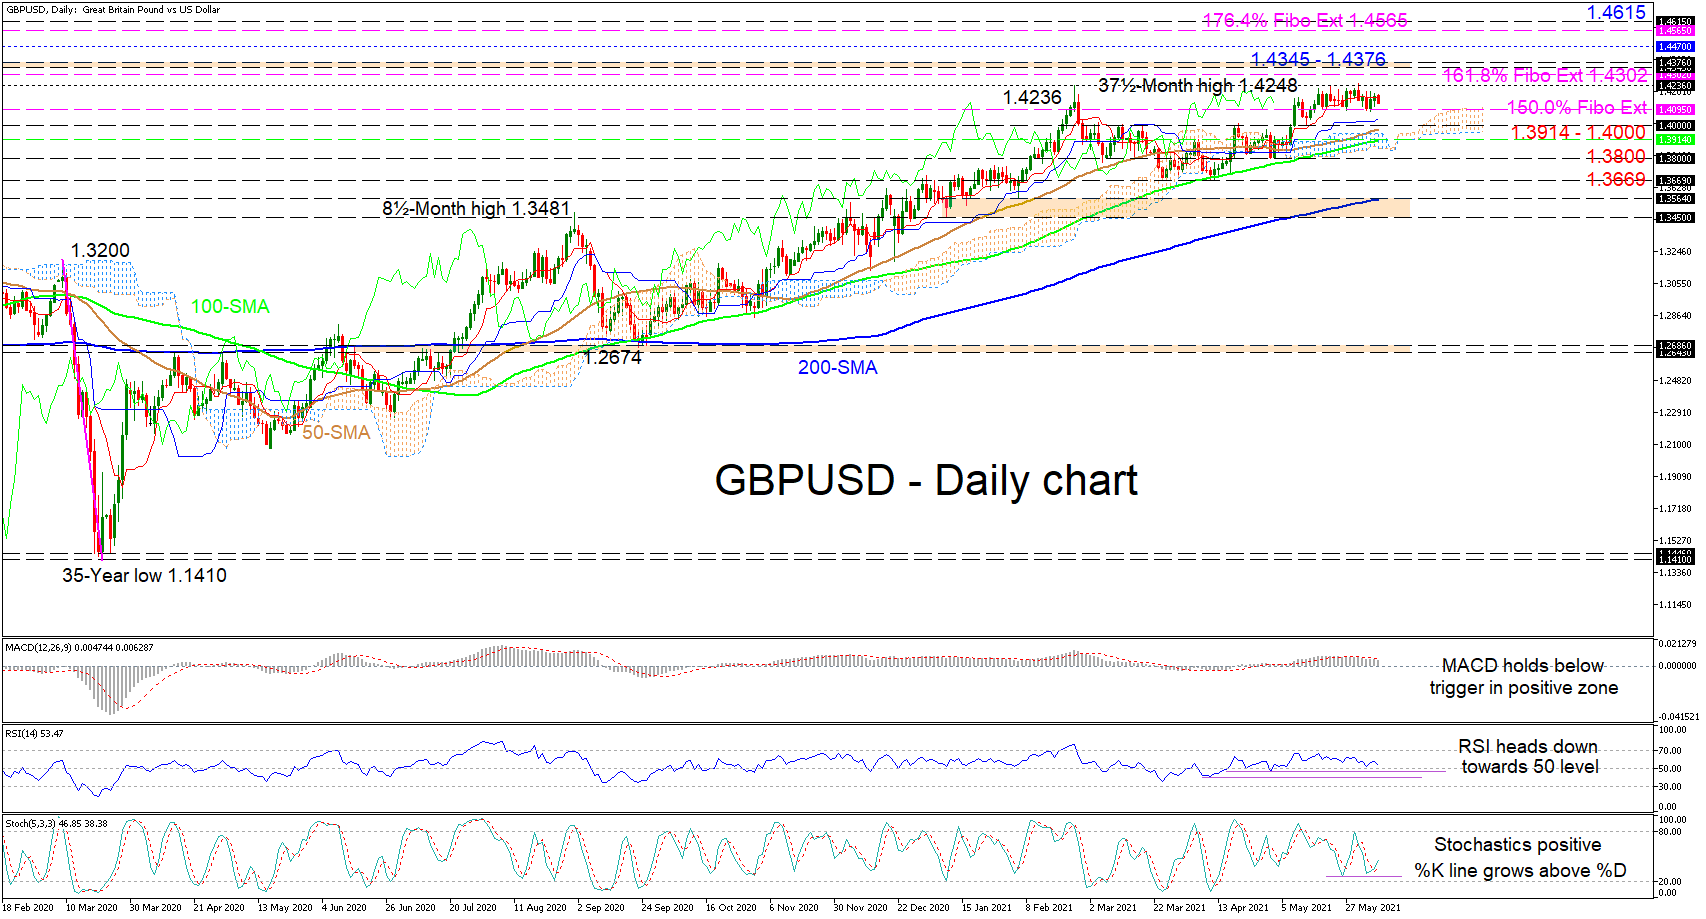
 GBPUSD is tiptoeing across the 1.4095 level, which happens to be the 150.0% Fibonacci extension of the down leg from 1.3200 until 1.1410, after multiple attempts in the pair failed to defeat the 1.4236 peak from February 24. Nonetheless, the bullish simple moving averages (SMAs) are safeguarding the uptrend.
The currently idle Ichimoku lines are demonstrating a loss of positive impetus; however, they are retaining a slight tilt to the upside. Additionally, the short-term oscillators are mirroring the minor dwindling in the pair around the red Tenkan-sen line but are also suggesting upside powers have yet to fully subside. The MACD, above zero, is trailing below its red trigger line, while the downward pointing RSI, continues to zig zag towards the 50 level. Alternatively, the stochastic oscillator is sustaining a positive charge, signalling a preference for additional price developments in the pair.
If buyers manage to successfully overstep the initial 1.4236 barrier, early upside constraints may arise from the 161.8% Fibo extension of 1.4302 and the neighbouring resistance section of 1.4345-1.4376, formed by the two rally peaks, identified in January and April 2018. Conquering these tough obstacles, newfound propulsion in the price could stall around 1.4470 before buyers tackle the 176.4% Fibo extension of 1.4565 and the adjacent 1.4615 border.
Otherwise, if the price steers below the 1.4100 mark, hardened support could emanate from the 1.4000 hurdle until the 100-day SMA at 1.3914. Deteriorating below the Ichimoku cloud could then sink the price to challenge the 1.3800 handle and the 1.3669 troughs.
Summarizing, GBPUSD’s uptrend remains intact above the 1.4000 frontier and the rising SMAs. However, a price retreat below the 1.3800 obstacle could nurture negative pressures.

Origin: XM


