 USDJPY has reversed back up after finding support at the red Tenkan-sen line.
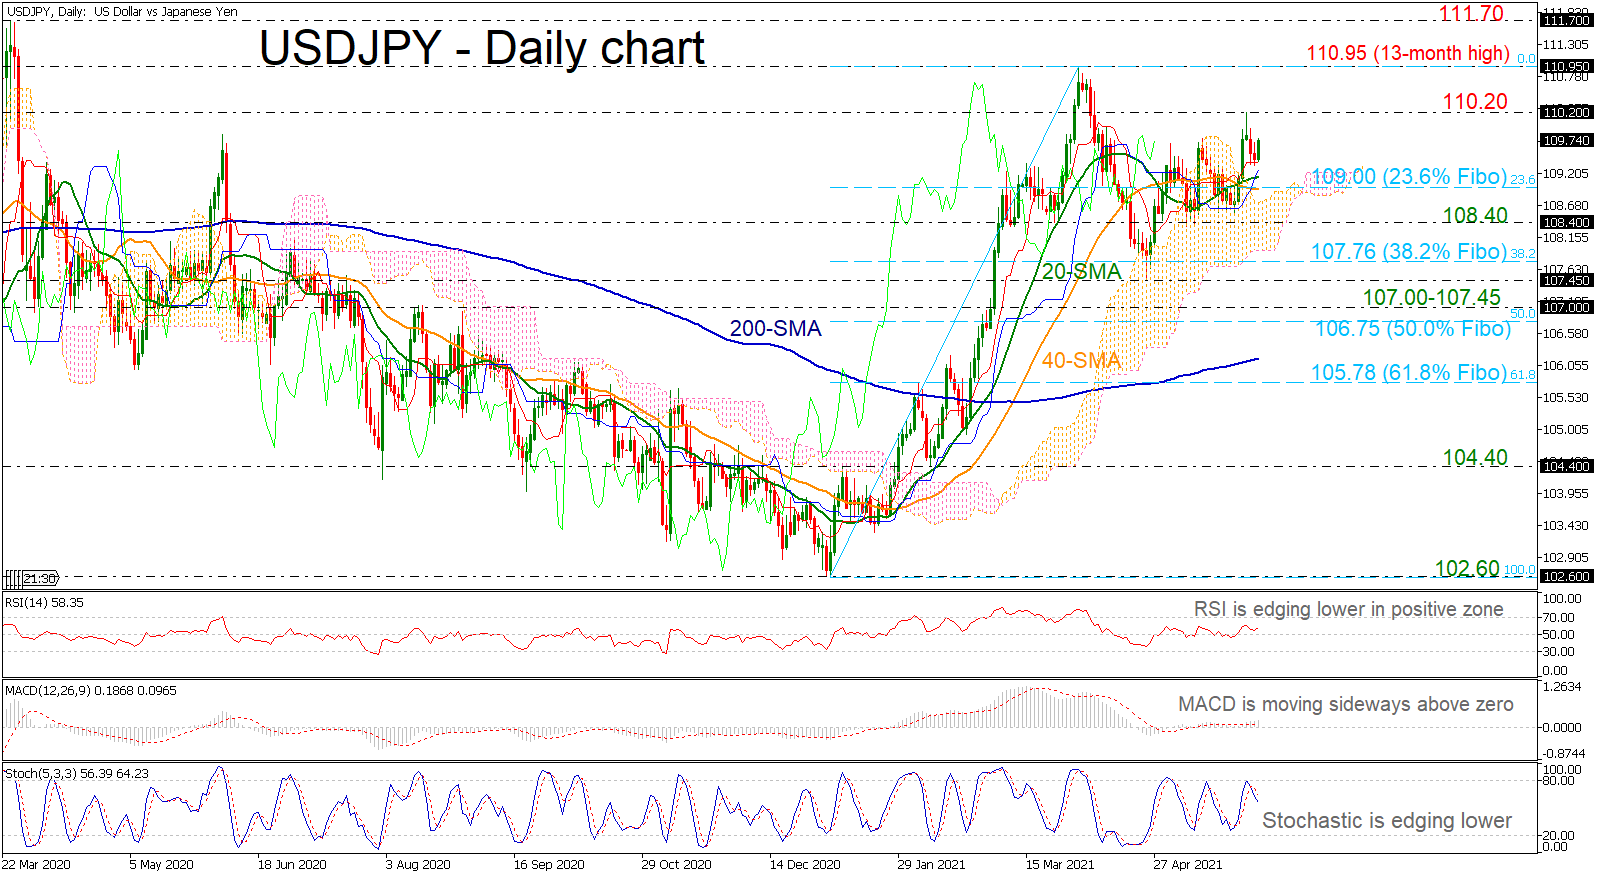
The momentum indicators are suggesting mixed signals in the short term with the RSI ticking higher in the positive territory and the stochastic is heading south after the bearish cross within the %K and %D lines suggesting a downside reversal is nearing. Moreover, the MACD oscillator is moving sideways in the bullish area.
In the event of an upside move, the 110.20 resistance could act as a barrier before being able to re-challenge the 13-month high of 110.95. A break above this level would reinforce the medium-term upside structure, hitting the 111.70 hurdle and the 112.20-112.40 zone.
Any downside movements should see the 109.00 psychological level, which is the 23.6% Fibonacci retracement level of the up leg from 102.60 to 110.95. A drop below the 20- and 40-day simple moving averages (SMAs) would reinforce the bearish structure in the short term and open the way towards the next key support level of 108.40 and the 38.2% Fibonacci of 107.76.
To sum up, USDJPY is showing some signals for a potential downside correction in the short-term, though, in the bigger picture, the market is still in a bullish mode.
Origin: XM