 USDCHF has erased a large part on the January – March rally, with the price extending its downtrend to a 3-month low of 0.8929 this week.
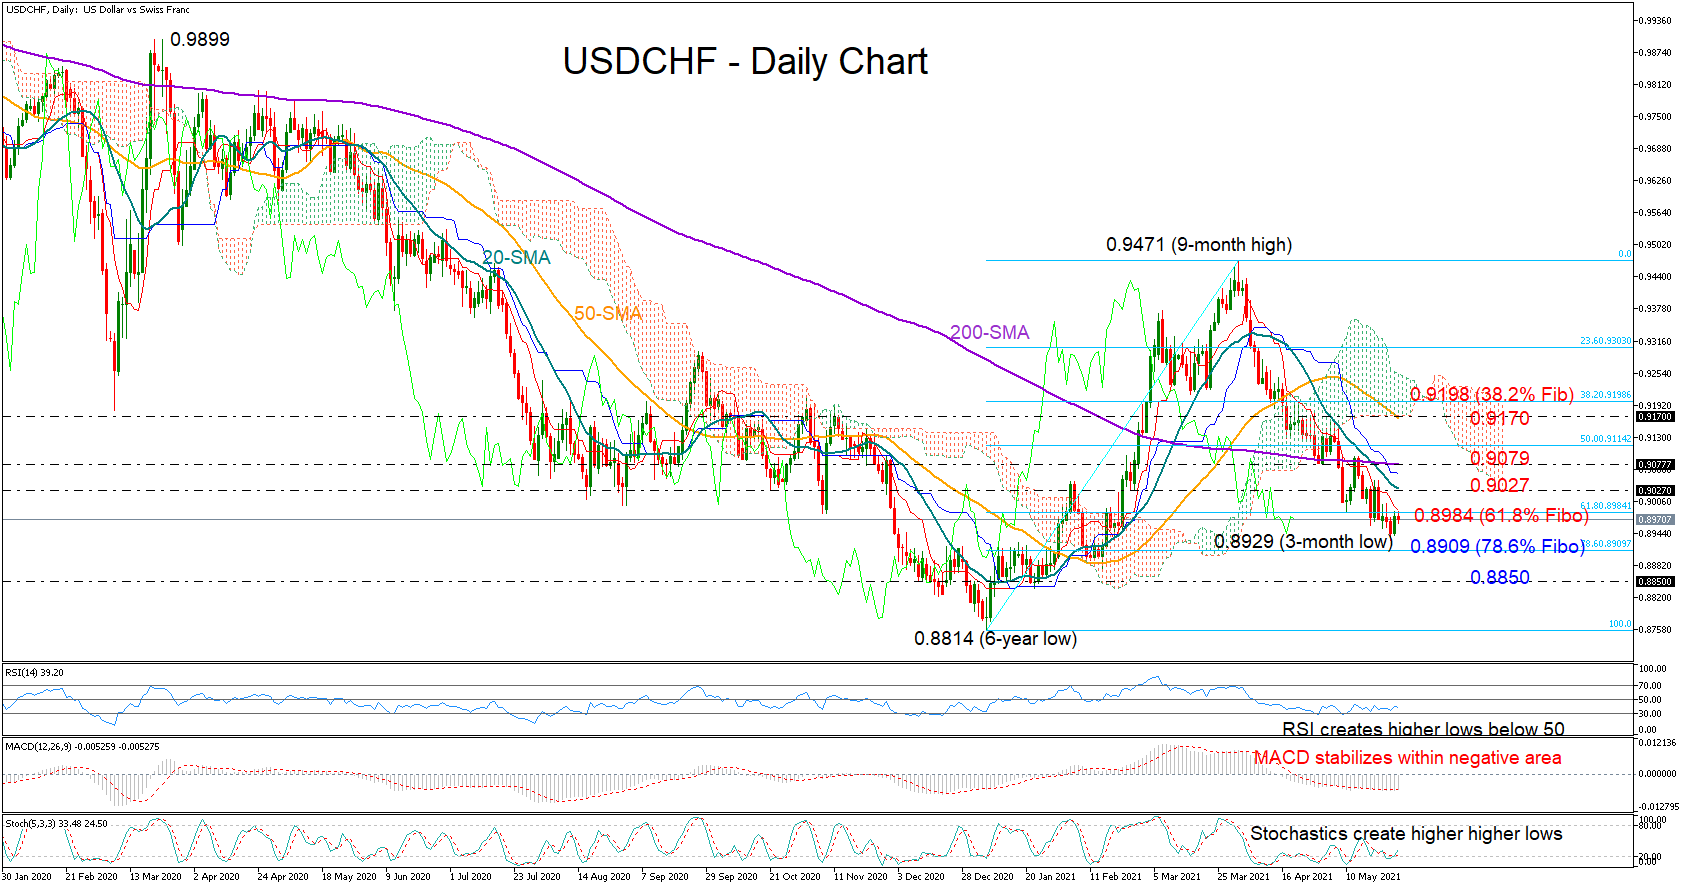
Having breached the 61.8% Fibonacci of the 0.8814 – 0.9471 uptrend, the bears are now eyeing the next Fibonacci level of 0.8909, a break of which will give way to the 0.8850 support region. Deeper, the bears may attempt to re-activate the long-term downtrend below the six-year low of 0.8814.
The technical picture keeps questioning any significant trend improvement as the 20-day simple moving average (SMA) has dipped back below the 200-day SMA, while the 50-day SMA also seems to be heading for a bearish cross with that line. Meanwhile in momentum indicators, the MACD, the RSI, and the Stochastics continue to move sideways in the bearish territory, though a positive divergence is evidence as the RSI and the Stochastics seem to be making higher lows, raising optimism that bullish forces could strengthen soon.
The path higher, however, could be a rocky one as several obstacles may quickly block the way. The 20-and 200-day SMAs at 0.9027 and 0.9079 respectively could immediately halt any upside moves above the 61.8% Fibonacci of 0.8984, which is currently acting as resistance. If these barriers prove easy to clear, the spotlight will turn to the 50-day SMA and the 38.2% Fibonacci of 0.9198.
In the medium-term picture, the pair would need an aggressive upturn above the 0.9471 peak for an outlook improvement.
Summarizing, USDCHF keeps endorsing its short-term downtrend, though upside corrections cannot be excluded in the near term as downside risks seem to be weakening.
Origin: XM