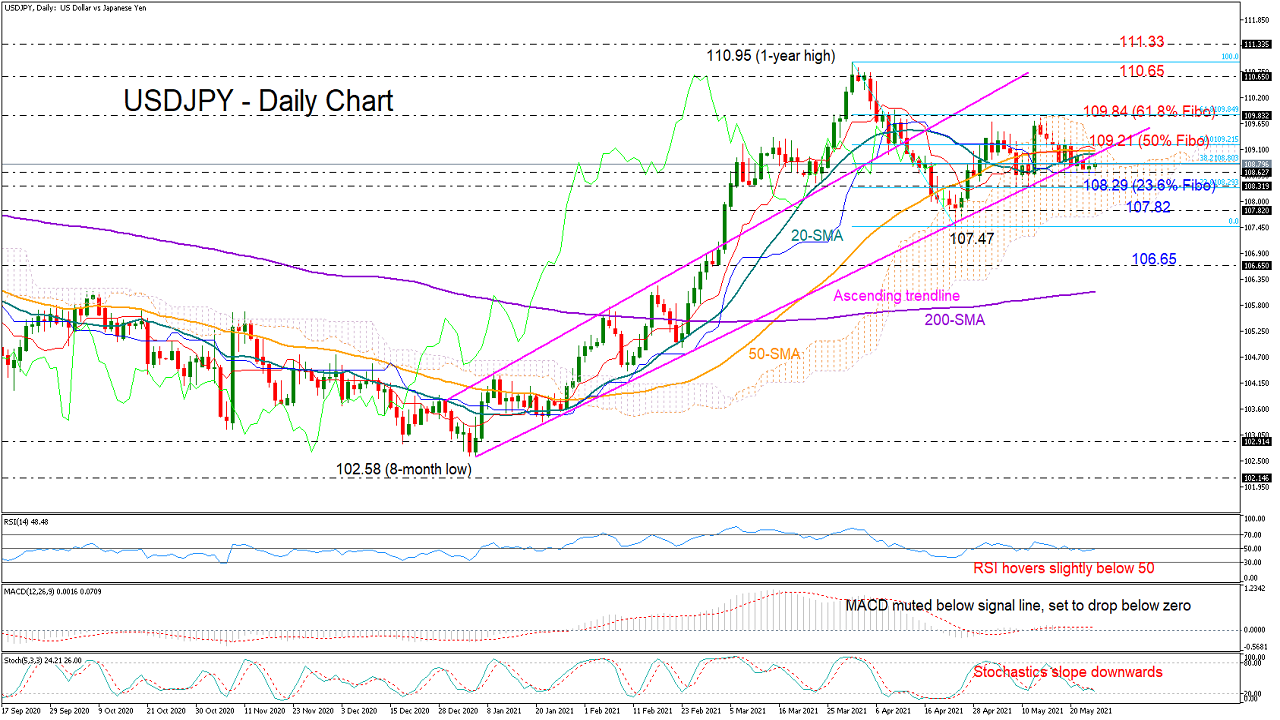
 USDJPY has been in a tight range underneath the 109.00 level this week, facing resistance near its shorter-term simple moving averages and support around the blue Kijun-sen line at 108.60.
The sideways move has positioned the price marginally below the tough ascending trendline, flagging more weakness in the near term. The momentum indicators are discouraging as well, with the RSI hovering slightly below its 50 neutral mark, the Stochastics sailing southwards, and the MACD preparing to enter the negative zone.
A drop below the 108.60 level, and particularly a close below the previous low of 108.29, where the 23.6% Fibonacci level of the 110.95 – 107.47 down leg is placed, could press the price towards the bottom of the Ichimoku cloud and near the 107.82 restrictive area. Slightly lower the 107.47 territory could be the last opportunity for a rebound before a more aggressive decline drives the price towards the 106.65 zone.
On the flip side, the bulls would need to crawl back above the trendline and beyond the 50% Fibonacci of 109.21 in order to reach the important resistance territory around 109.84. The 61.8% Fibonacci is laying around the same level. Hence, any violation here could confirm additional gains likely up to the 110.65 – 110.95 hurdle, a break of which would put the pair back on an upward path.
Summarizing, USDJPY is holding a neutral-to-bearish bias in the short-term picture, where a move below 108.60 is expected to raise selling pressures. Alternatively, for an upside reversal to boost buying appetite it would need to stretch above 109.21.
Origin: XM