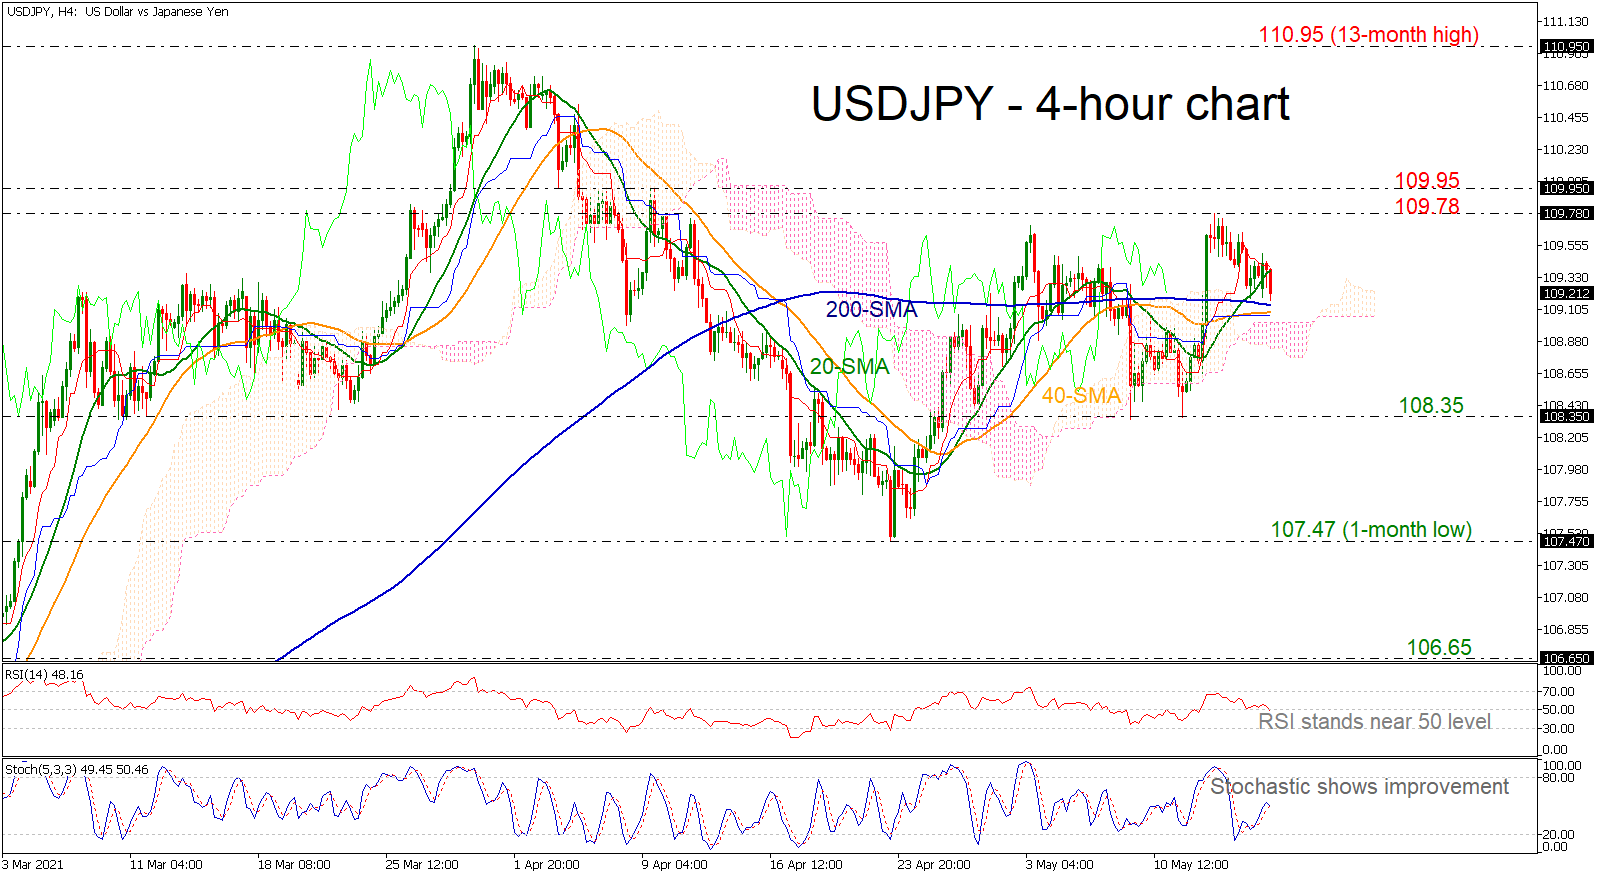
 USDJPY is retreating after it topped at the 109.78 resistance level. The price is finding support at the 200-period simple moving average (SMA). The RSI seems to be in a declining mode, however, the stochastic oscillator is posting a bullish crossover within the %K and %D lines in the four-hour chart.
If there are any dives beneath the SMAs, the lower surface of the Ichimoku cloud could halt bearish movements at 108.75 before tumbling to the 108.35 support level. Even lower, the one-month low at 107.47 could attract attention ahead of 106.65.
Otherwise, a rebound on the 200-period SMA could take the price up again, meeting the 109.78-109.95 restrictive area and then the 13-month peak of 110.95.
In conclusion, USDJPY has been in an ascending movement since April 23, while in the bigger picture the pair is neutral and only a climb above 110.95 may shift the outlook back to strongly positive.
Origin: XM