


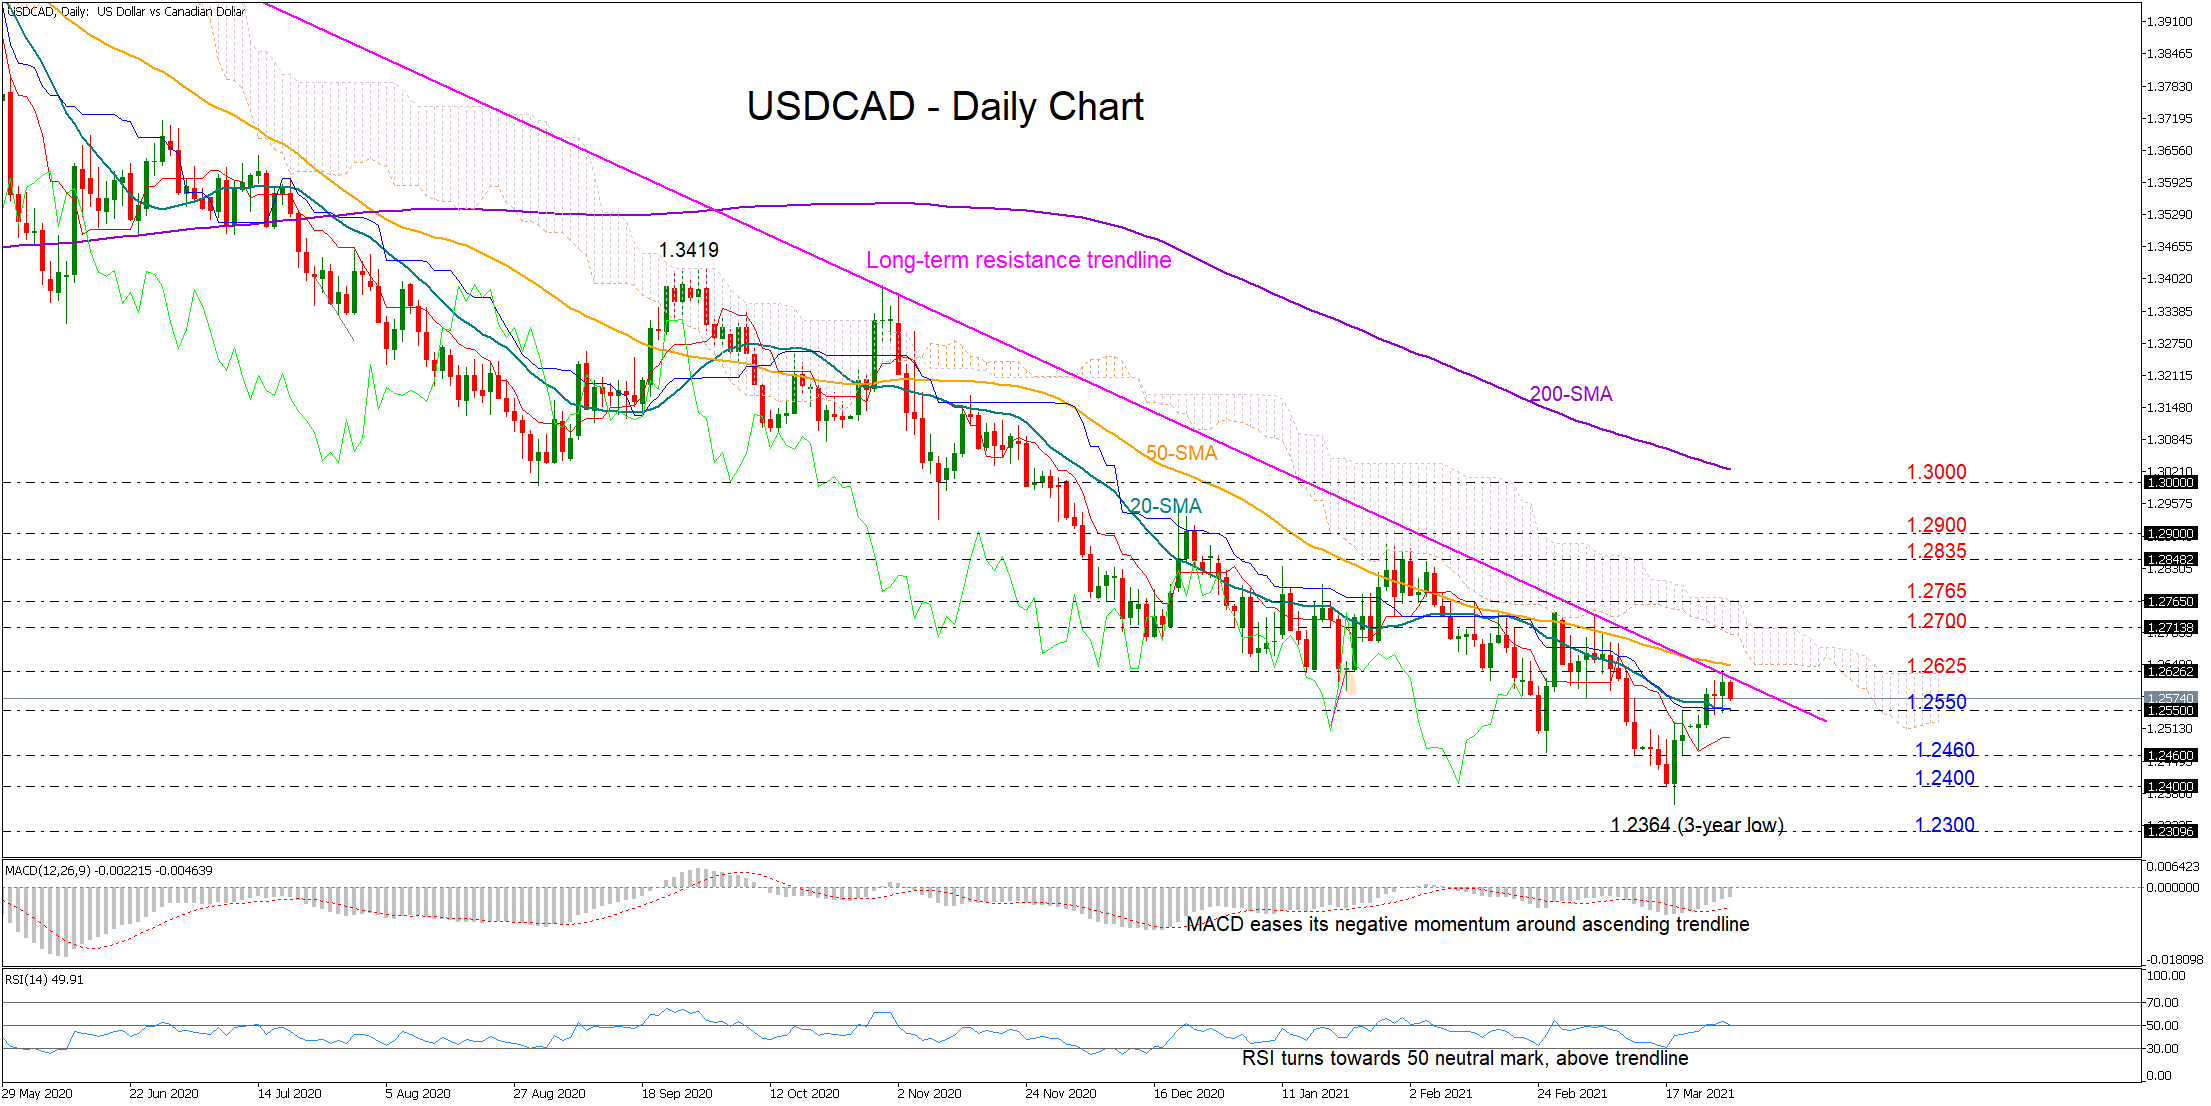
 USDCAD is set to close with moderate gains for the second consecutive week, though questions are being raised about whether the latest upside correction can see a further continuation in the coming sessions as the pair is currently battling with the one-year-old resistance trendline. Not far above, the 50-day simple moving average (SMA) and the lower boundary of the Ichimoku cloud could enhance that wall as they did early this month.
Although the RSI and the MACD have shown some improvement, the former seems to be struggling to hold above its 50 neutral mark, while the latter has yet to cross above the zero line. The Ichimoku indicators also remain a bit discouraging, as the red Tenkan-sen line is still located some distance below the blue Kijun-sen despite its latest rebound.
A bounce above the trendline and inside the cloud is expected to stretch till the important area of 1.2700 – 1.2765, where any break higher could raise some confidence that an uptrend may be in progress, likely bringing the 1.2835 – 1.2900 resistance region next into view.
Otherwise, failure to breach the long-term trendline and a close below the 20-day SMA at 1.2550 could activate a steeper downfall towards the 1.2460 – 1.2400 supportive zone. Should sellers dominate below the latter, the spotlight will shift to the 1.2300 round-level.
Briefly, USDCAD is in a neutral mode in the very short-term picture, ranging between a tough resistance trendline and the 20-day SMA. Any violation of these boundaries could direct the pair accordingly. For a more sustainable rally, the price should overcome the 1.2700 – 1.2765 zone.
Origin: XM


