 NZDUSD’s bearish tone seems to have somewhat stabilised and the pair is now ranging within the boundaries of 0.7082 and 0.7280. The flattening and merged Ichimoku lines as well as the horizontal posture of the Ichimoku cloud are endorsing a more sideways price market. The directional scale appears to have tilted back to neutral, something also being conveyed through the opposing signals from the 50- and 100-period simple moving averages (SMAs)and the steadied 200-period SMA.
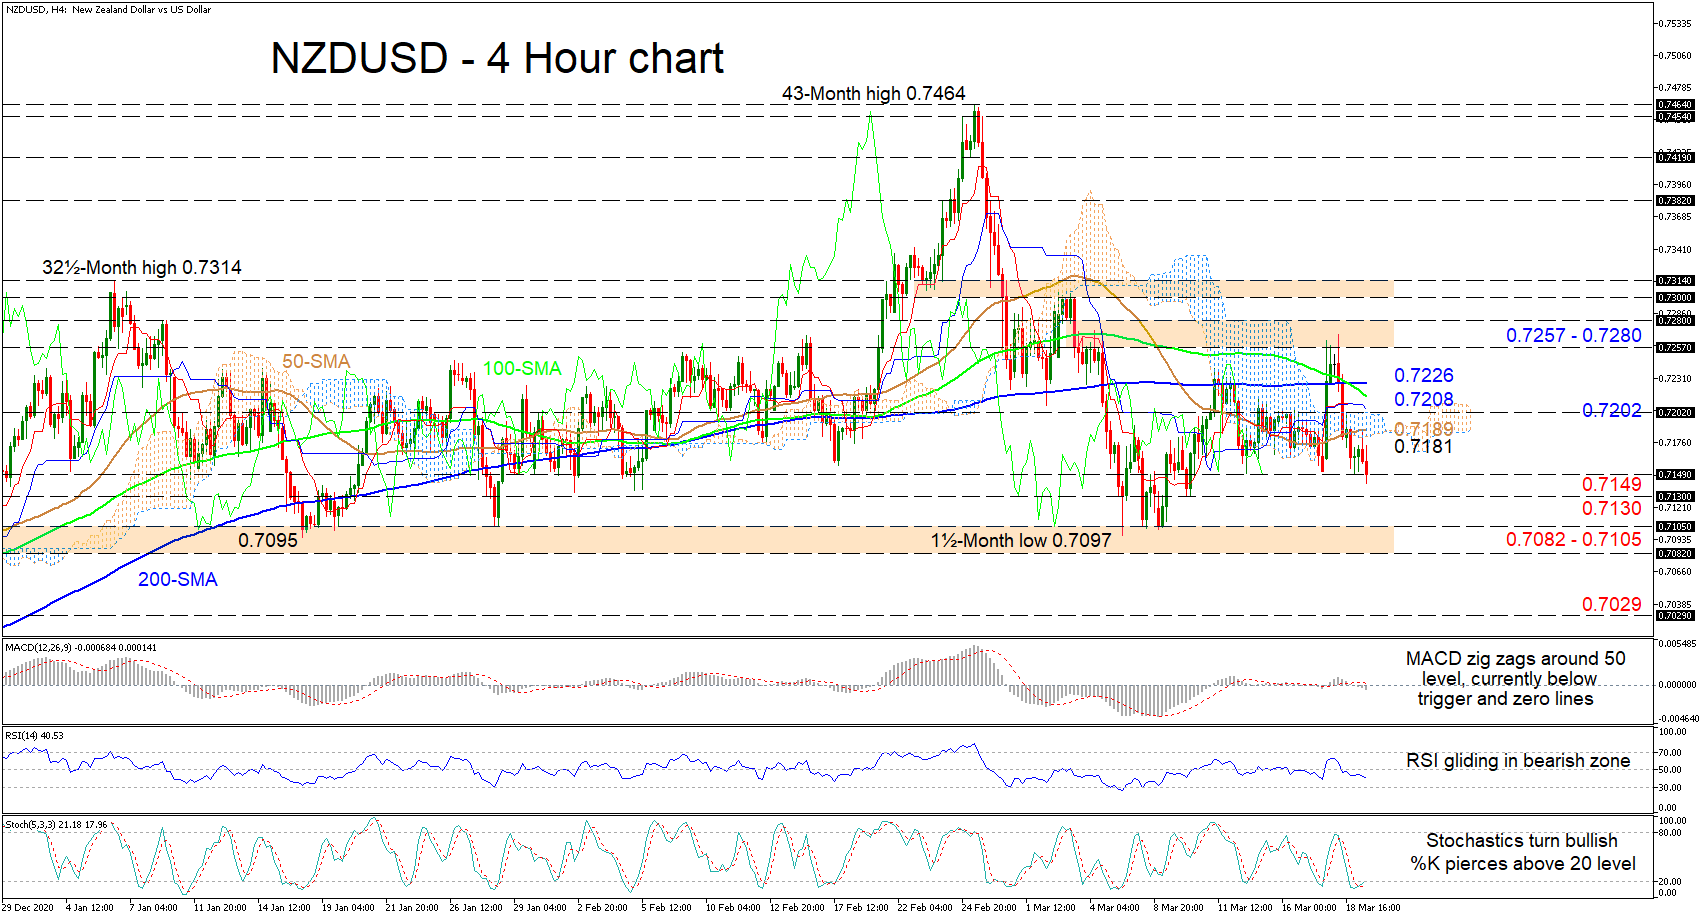
The short-term oscillators are also transmitting conflicting signals in directional momentum. The MACD, below its red trigger line is slightly underneath the zero mark and is heading down, while the RSI is slowly gliding lower in the bearish territory. However, the stochastic oscillator, which is looking increasingly bullish as the %K line is nudging above the 20 level, is promoting additional price improvements.
If buyers re-emerge, resistance could commence from the cloud’s lower band at 0.7181 and the adjacent 50-period SMA at 0.7189 ahead of the 0.7202 border. If the price overtakes the cloud, an upside limiting area from the Ichimoku lines at 0.7208 until the 200-period SMA at 0.7226 could impede the pair from challenging the ceiling of the range – being the zone of 0.7257-0.7280.
If sellers manage to decisively dive beneath the 0.7149 obstacle, the 0.7130 low could provide some friction before the base of the consolidation from 0.7105 to 0.7082 is examined. In the event sellers plunge through this key foundation, next support may arise around the 0.7029 obstacle.
Summarizing, a clear break of the lower boundary of 0.7082-0.7105 or the upper boundary of 0.7257-0.7280 will dictate the next price direction. Though NZDUSD is confined between these restrictions, the picture is slightly skewed to the downside as the pair holds below the SMAs.
Origin: XM