


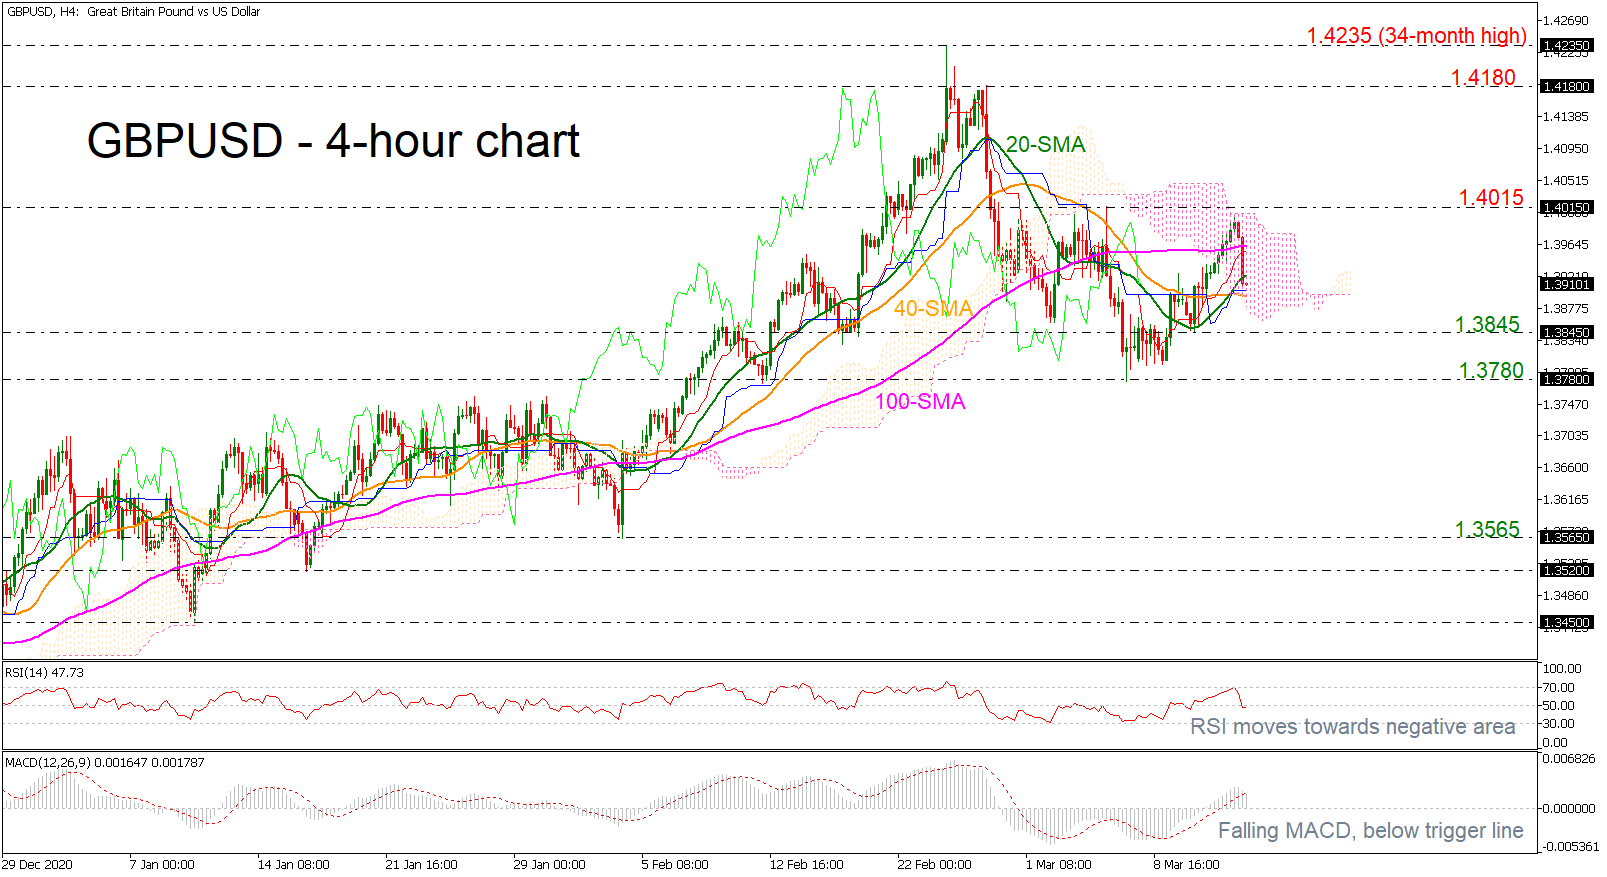
 GBPUSD has come under renewed selling interest today around 1.3900, diving below the 100-period simple moving average (SMA) in the 4-hour chart.
The price is hovering in the Ichimoku cloud and the technical indicators are suggesting a downside movement. The RSI is tumbling around the neutral-threshold of 50, after the pullback off the overbought territory, while the MACD is losing ground in the positive region.
Steeper decreases could find immediate support at the 1.3845 barrier ahead of the 1.3780 hurdle, taken from the latest lows. More downside pressure could take the market until the 1.3565 obstacle, registered on February 4.
In the opposite scenario, a successful leg above the 100-period SMA could meet the 1.4015 resistance before jumping towards the 1.4180 line. Above that, the 34-month high of 1.4235 could attract bulls’ attention.
To sum up, in the very short-term view, GBPUSD has been in a descending move, surrendering some gains of the preceding days. However, in the long-term outlook, cable has been in a bullish tone since September 2020.
Origin: XM


