


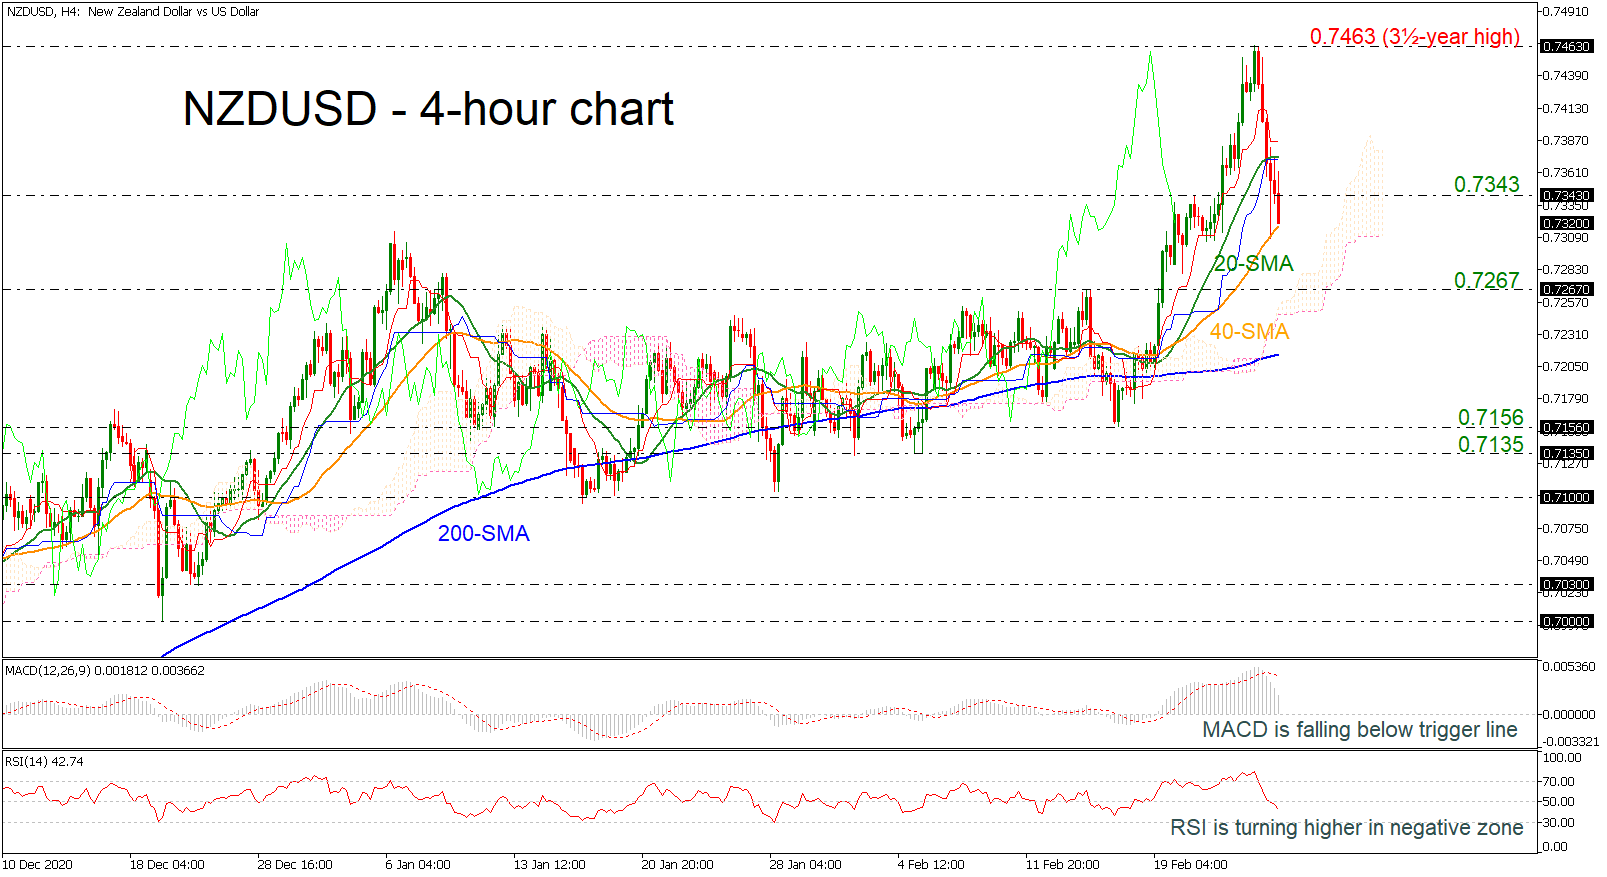
 NZDUSD is diving below the more than three-and-a-half-year high of 0.7463, slipping below the 20-period simple moving average (SMA). This aggressive move is confirmed by the MACD oscillator, which is falling below the trigger line. However, the RSI is turning higher around the neutral threshold of 50. In trend indicators, the red Tenkan-sen line and the blue Kijun sen line are flattening above the current market price.
Steeper decreases could take the market until the 40-period simple moving average (SMA) at 0.7320 before declining to the 0.7267 support. The next target could be the 200-period SMA at 0.7214 and the 0.7156 barrier.
On the flip side, an upside move could open the door for the 20-period SMA at 0.7374 ahead of a sharp move towards the multi-year peak of 0.7463.
Summarizing, NZDUSD has been creating a bearish movement over the last couple of days, and any moves below the 200-period SMA could switch the bigger picture to neutral.
Origin: XM


