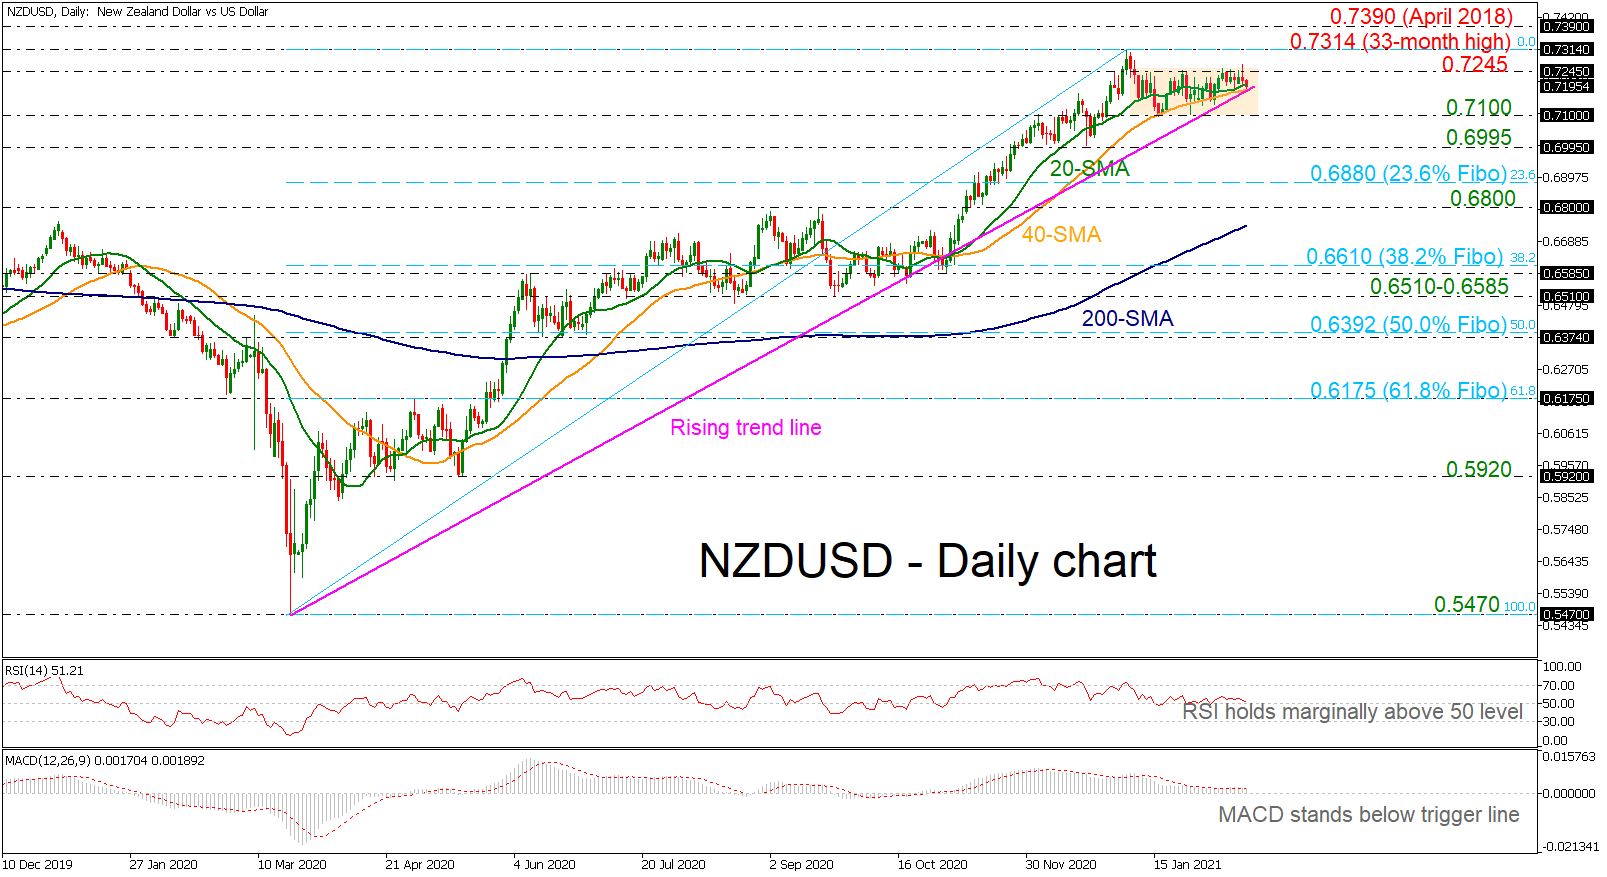
 NZDUSD is moving in a horizontal trajectory over the last five weeks, slightly above the 20- and 40-day simple moving averages (SMAs) and the ascending trend line. The RSI is edging sideways with weak momentum in the positive zone, while the MACD is remaining beneath its trigger line, mirroring the latest move in the price action.
The price found significant resistance at 0.7245 several times in the preceding days and if there is a successful attempt above it, the price could meet the 33-month high of 0.7314. Steeper increases could extend the bullish structure towards the 0.7390 barrier, being the peak in April 2018.
If, however, the upside momentum was to lose steam and the pair reverses lower, support would initially come from the uptrend line around the 0.7190 level. Slipping below this line could take prices towards the 0.7100 handle. Below that, 0.6995 and the 23.6% Fibonacci retracement level of the upward wave from 0.5470 to 0.7314 at 0.6880.
Summarizing, in the long-term view, the bullish outlook remains intact since March 2020. However, the price seems to losing steam in the very short-term.
Origin: XM