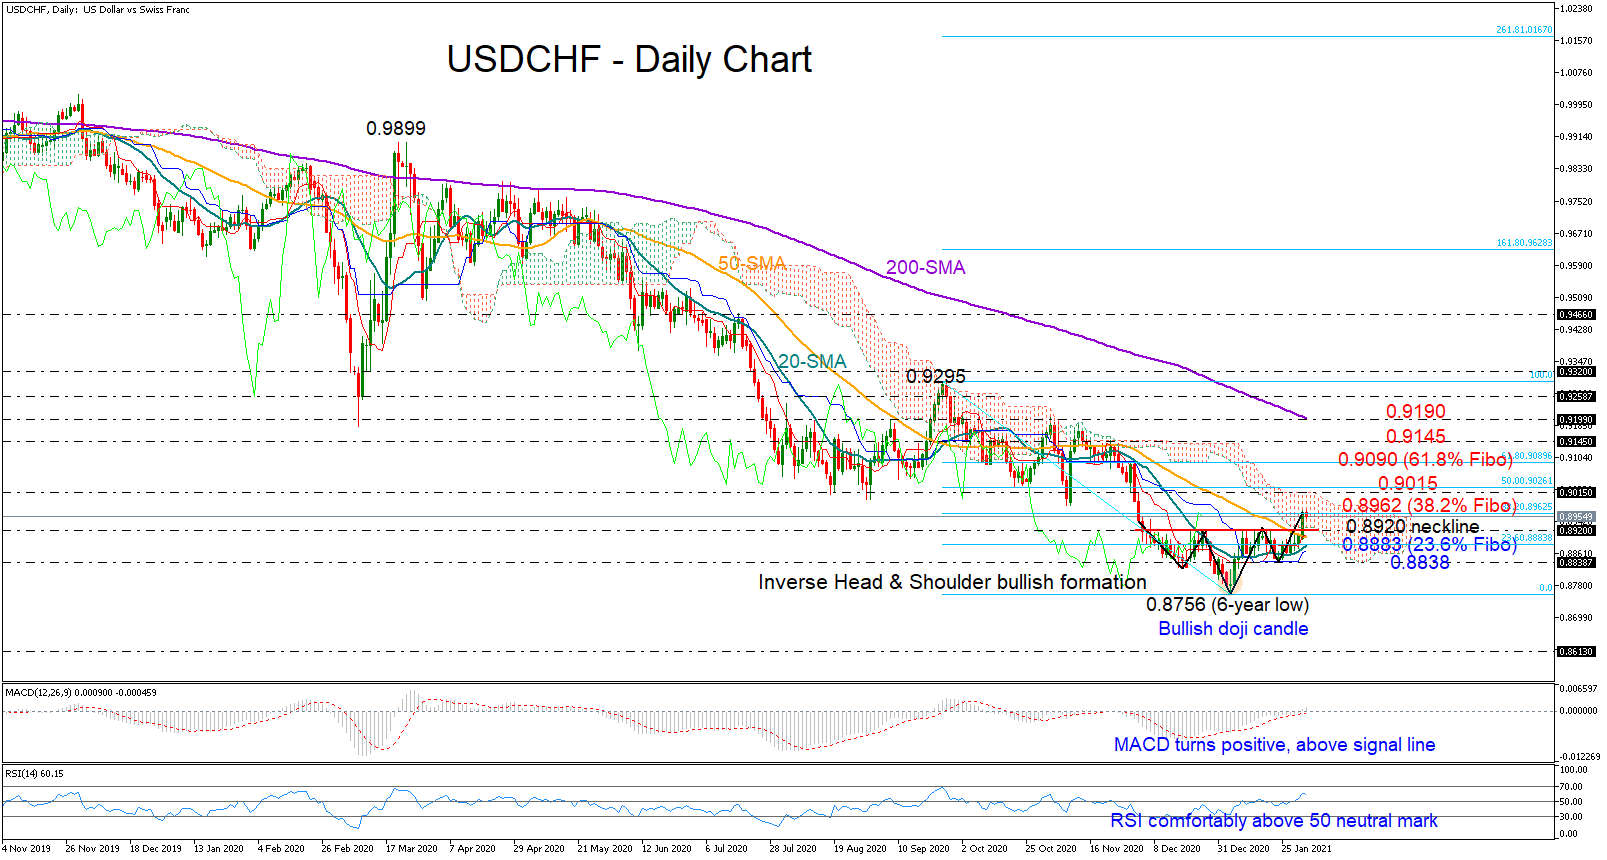
 USDCHF charted an inverse head and shoulder formation at the bottom of its sell-off, where a six-year low of 0.8756 has taken the form of a bullish doji in early January, signalling the end of the bearish phase.
The case of a trend reversal further strengthened on Monday after the price closed clearly above the neckline of the structure at 0.8920. The RSI and the MACD are backing the bullish appetite in the market as well, with the former gaining ground above its 50 neutral mark and the latter exploring the positive territory for the first time since October.
However, not far above the price action, the surface of the Ichimoku cloud has been a burden for the bulls during the autumn season. Hence, a break above that ceiling, currently seen near 0.9015 and slightly below the 50% Fibonacci of the 0.9295 – 0.8756 down leg, is required to cement recovery. Beyond that, the 61.8% Fibonacci of 0.9090 could be the next resistance, where any violation may give the green light for a tougher battle with the 0.9145 – 0.9190 restrictive region. This is also where the 200-day simple moving average (SMA) is converging.
On the other hand, if the 38.2% Fibonacci of 0.8962, which is currently in action, rejects additional upside movements, the spotlight will turn to the 0.8920 neckline and the 23.6% Fibonacci slightly beneath. Failure to rebound here would ruin the case of a trend reversal, likely triggering another negative extension towards 0.8838. Lower, the bears may attempt to re-activate the downward pattern below the six-year low of 0.8756.
In brief, USDCHF is looking to end its falling trend, but it may have to set a foothold above 0.9015, in order to convince over a more sustainable rebound.
Origin: XM